
Quick Summary
With massive enterprise data, C-Suite executives struggle to get a department-wise or process-wise view of their entire organization for effective decision-making. However, business intelligence tools like Tableau and their next-gen advanced dashboards help executives speed up their decision-making by delivering key analytics & metrics right on the interactive dashboard. Tableau presents text and mined data into visual dashboards that are easy to interpret. This makes them a reliable go-to tool for business intelligence and executive dashboard needs.
Introduction
Most of the decisions C-level executives and leaders took traditionally were based on individual decision-making capabilities and skills developed over time. While gut-feeling and experience-based decisions are prudent in many cases, they can still cause chaos if driven by prejudice, bias, and a wrongly assessed situation. Also, C-Suite executives may not get time to monitor and keep track of everything happening in their businesses unless it is present in a centralized, uniform, and patterned form.
This is where the need for automated business intelligence tools and analytics dashboards arise. Also, as businesses scaled, data overwhelm caused C-suite leaders to find respite in executive dashboards. Tableau is one of them and yes, it is one of the top sought BI dashboards by executives owing to its powerful visualization capabilities in converting complex data into easy to comprehend patterns and visuals, user-friendly interface, and ability to handle large datasets efficiently.
“Let us dwell deep into the top 7 impactful Tableau executive dashboards that C-suite executives depend on for their decision-making needs.”
Top 7 Tableau Executive Dashboards Reshaping C-Suite Decisions

Executive dashboards have consistently helped leaders with data suggesting that 77% rely on dashboards for making strategic decisions across business operations, from strategy and operations to finance, marketing, and customer experience. The most widely used executive dashboards include Tableau, Microsoft Power BI, Qlik Sense, Domo, and Sisense, etc.
Tableau interactive dashboards in particular are known for their exceptionally concise, interactive, and visually compelling way of helping C-suite leaders make informed decisions, through real-time analytics, intuitive design, and data storytelling.
Tableau is acing charts and has been named a leader in the 2024 Gartner magic quadrant for Analytics and BI Platforms.
“As a leader providing Tableau consulting services and some of the best executive dashboards in Tableau, we bring our expertise to look at 7 powerful Tableau executive dashboard examples driving business success.”
1. CMO Dashboard
A recent study by Gartner highlights that organizations that use data-driven marketing are 6 times more likely to be profitable year-over-year, and a CMO dashboard helps CMOs do exactly that. A Tableau CMO dashboard has proven to be extremely efficient in delivering end-to-end information about campaign effectiveness, lead generation, conversion rates, and return on marketing investment (ROMI).
Clients across domains globally use the Tableau dashboard for their ability to integrate data from various channels including social media, email campaigns, and paid advertising, thus allowing CMOs and leaders to assess which strategies yield the highest ROI.
The USP of the CMOS dashboard lies in the visualization it provides about conversion rates across different campaigns. This helps in highlighting successful tactics and gives a preview of areas that need improvement, helping drive efficient and effective marketing efforts. Tableau consulting companies help marketing officers make informed marketing decisions for customer acquisition and retention.
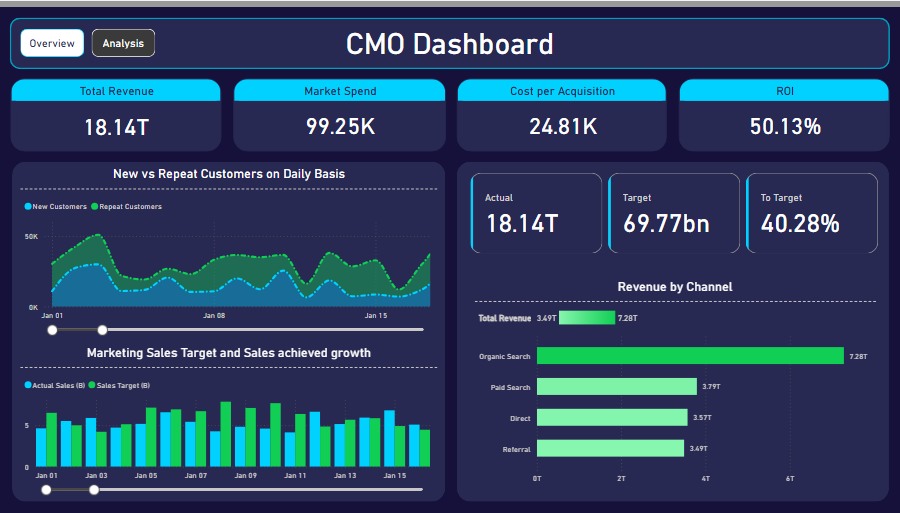
Image Source: CMO Dashboard
Key Differentiator of Tableau CMO Dashboard
Tableau executive dashboards for CMOs are unlike other marketing analytics tools as they integrate data from multiple sources, providing real-time insights with customizable visualizations. Professional Tableau consulting services use Tableau’s AI-powered analytics features that help uncover hidden sales trends and forecast performance with greater accuracy.
- Cross-Channel Integration: Tableau’s CMO dashboards are adopted by leaders for their ability to collaborate data from various marketing channels. This proves to be highly beneficial for organizations that want a unified view of strategic decision-making.
- Real-Time Campaign Monitoring: CMOs gain real-time data visualization and can make quick adjustments to their marketing campaigns, and help drive improved engagement and ROI.
- Customizable Visuals: The customized visualization offered by Tableau is a highly potent way for CMOs to focus on metrics that align with super-specific and niche business goals.
- Predictive Analytics: Tableau consultant power dashboard with AI-driven insights, which makes it hyper-effective in forecasting market trends. This helps CMOs in proactive strategy development.
- Hyper-Collaborative Platform: Tableau dashboards are made to be highly collaborative where marketing teams can come together to improve alignment and efficiency.
Essential Metrics in a CMO Dashboard
- Customer Acquisition Cost (CAC)
- Marketing ROI (MROI)
- Social Media Engagement Rates
- Lead Conversion Rates
From custom dashboard development to advanced analytics integration, let X-Byte create custom Tableau dashboards for you!
2. Sales Summary Dashboard
Sales processes have moved from traditional hard selling approaches to a more strategic one powered by sales dashboards that offer a high-level overview of sales performance. A McKinsey report shows that organizations using dynamic sales dashboards have the potential to increase sales productivity by up to 20%.
A Tableau sales dashboard is one of the prime Tableau executive dashboard examples, empowering sales leaders to monitor targets and outcomes through a structured view of metrics like total sales, sales by region, product performance, and sales team effectiveness.
An effective sales dashboard may provide a heat map indicating sales volume by region and can help identify high-performing areas and regions needing attention. Additionally, it helps shortlist and recognize top performers by tracking individual sales representatives’ performance.

Image Source: Sales Dashboard
Key Differentiator of Tableau Sales Dashboard
The real-time visibility provided by the executive summary dashboard in Tableau enables swift adjustments to sales strategies and helps optimize resource allocation by providing data-driven sales strategies that align with business goals.
- Dynamic Data Updates: Sales teams need to have real-time sales figures, conversion rates, pipeline status, and revenue forecasts on their fingers and must stay up-to-date idea about key sales metrics like key sales metrics like customer acquisition cost (CAC), average deal size, and sales cycle length. A custom Tableau sales dashboard enables teams to respond quickly to market changes through key sales metrics like customer acquisition cost (CAC), average deal size, and sales cycle length.
- Geospatial Analysis: Sales leaders can gain a competitive edge if they can identify regional performance patterns, to develop targeted strategies. Tableau sales dashboard have geo-analytics capabilities, adding the ability to map sales data and allowing sales leaders to identify regional performance patterns, and inform targeted strategies.
- Performance Benchmarking: Tableau consultants deliver a highly effective sales dashboard that enables comparison against industry standards in sales. This helps leading organizations and sales teams to set realistic targets.
- Mobile Accessibility: Tableau’s sales dashboard allows sales leaders and executives to stay connected with the performance of sales executives on the go on mobile devices, driving informed decisions when needed.
- Interactive Filters: The interactive filters help users to drill down into specific data segments. This helps in uncovering detailed insights about sales performance.
Essential Metrics in a Sales Dashboard
- Monthly Recurring Revenue (MRR)
- Sales Growth Rate
- Conversion Rates by Channel
- Average Deal Size
3. Healthcare Dashboard
Healthcare is rampant with big data from payers, providers, medtech companies, and more. Integrating this data can not only ease operations but also help provide better patient care and value-based services. Healthcare dashboards are effective in helping providers gain insight into patient outcomes, utilizing resources effectively, and improving the way healthcare organizations operate, by aggregating data from EHRs, patient surveys, and staffing schedules. It provides a real-time overview of hospital performance and supports healthcare professionals in making informed decisions.
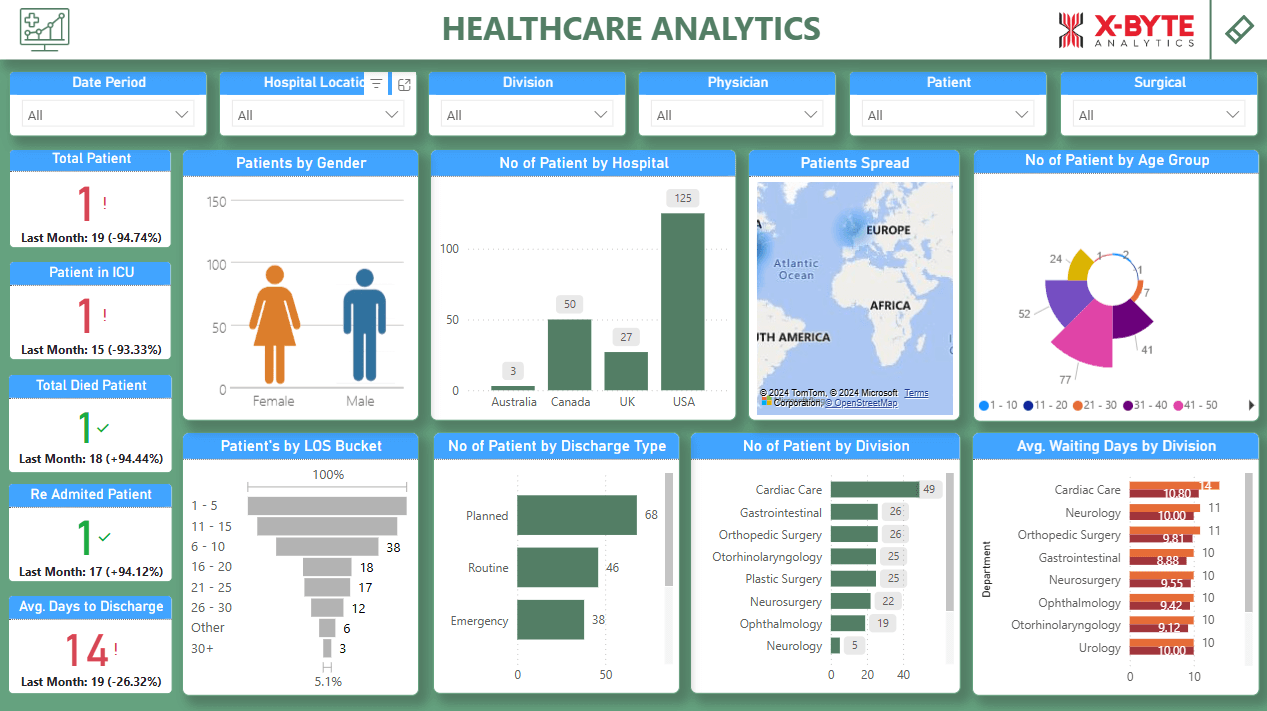
Image Source: HealthCare Dashboard
Key Differentiator of Tableau Sales Dashboard
Interactive, real-time patient and deep insights for proactive decision-making are the need of the hour for healthcare to make it more value-based. Professional Tableau consulting services deliver dashboards that go beyond static reporting and enable these benefits.
- Patient Outcome Tracking: The sensitive healthcare sector can get real-time updates and monitor patient outcomes through healthcare dashboards, thus aiding in the assessment of treatment effectiveness.
- Resource Allocation: Healthcare organizations can delegate tasks, optimize staffing, and deploy equipment based on the visualization that the healthcare dashboard provides, reducing overwhelm.
- Compliance Monitoring: Compliance monitoring is imperative and very critical for healthcare and the healthcare dashboard from Tableau tracks adherence to healthcare regulations, thus ensuring compliance and quality care.
- Patient Satisfaction Analysis: The Tableau dashboard for healthcare can help integrate survey data and help healthcare providers in improving patient experiences.
- Predictive Health Trends: Potential health crises can be averted and proactive measures taken through the AI integration feature of real-time Tableau executive dashboards.
Essential Metrics in Healthcare Dashboards
- Bed Occupancy Rates
- Patient Satisfaction Scores
- Average Treatment Time
- Readmission Rates
4. CFO Dashboard
The financial health of organizations can no longer be based on legacy systems involving traditional methods like manual bookkeeping, static spreadsheets, and retrospective financial reporting. Current times call for innovative methodologies where real-time financial analytics, AI-driven forecasting, and automated risk assessment are part of every financial decision-making.
Tableau’s CFO dashboards facilitate this by providing a view of financial metrics and offering insights into cash flow, profit margins, and expense management. These high-end CFO dashboards integrate data from accounting systems, budgets, and forecasts, and detect anomalies, thus helping CFOs and leaders in making decisions that drive profitability. Tableau CFO dashboards are a must-have for centralizing finances enabling organizations to automate alignment with best practices in financial management.
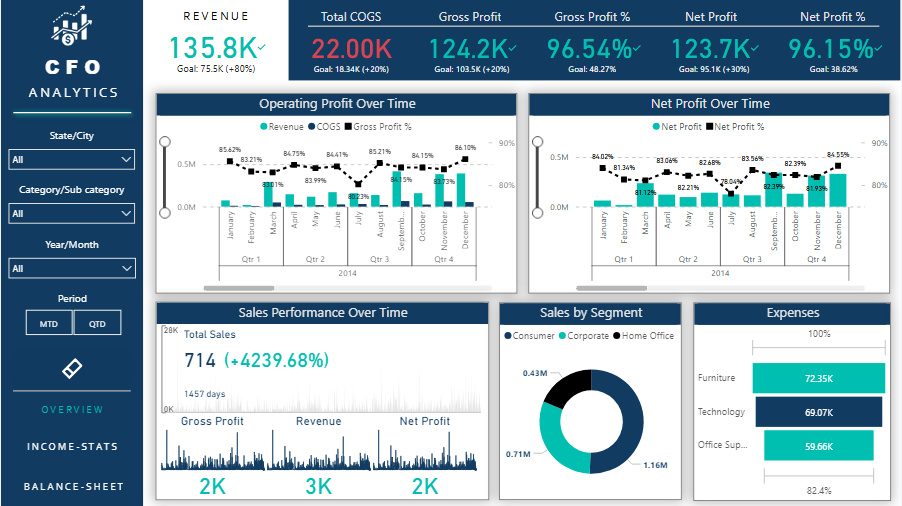
Image Source: CFO Dashboard
Key Differentiator of Tableau CFO Dashboard
Where legacy financial tools lack dynamic forecasting, Tableau’s CFO dashboard provides a dynamic view of data on dashboards with automated variance analysis, reducing manual effort.
- Financial Consolidation: Tableau aggregates financial data from various departments, offering a comprehensive financial overview.
- Cash Flow Visualization: The Tableau dashboard uses cash flow analytics and real-time financial visualization tools which helps CFO’s to get interactive visuals depicting cash flow trends, aiding in liquidity management.
- Risk Assessment: Missing out on issues that cause financial risks can be a disaster, and real-time Tableau executive dashboards help avoid these through real-time anomaly detection, automated risk assessment, and predictive analytics, thus, supporting the development of mitigation strategies.
- Investment Analysis: Tableau evaluates investment performance, guiding informed capital allocation decisions.
Essential Metrics in a CFO Dashboard
- EBITDA
- Cash Flow Statements
- Budget vs. Actual Spending
- Debt-to-Equity Ratio
5. Finance Dashboard
Gartner highlights that organizations that use finance dashboards have the chance to reduce budget preparation time by 30%. The finance dashboard differs from CFO dashboards by providing leaders insight into key financial indicators such as revenue growth, cost analysis, and financial ratios. It is a potent way for decision-makers to track financial performance against goals, identify trends, and assess the impact of financial decisions.
Finance dashboards support a culture of data-driven decision-making and financial discipline across the organization.
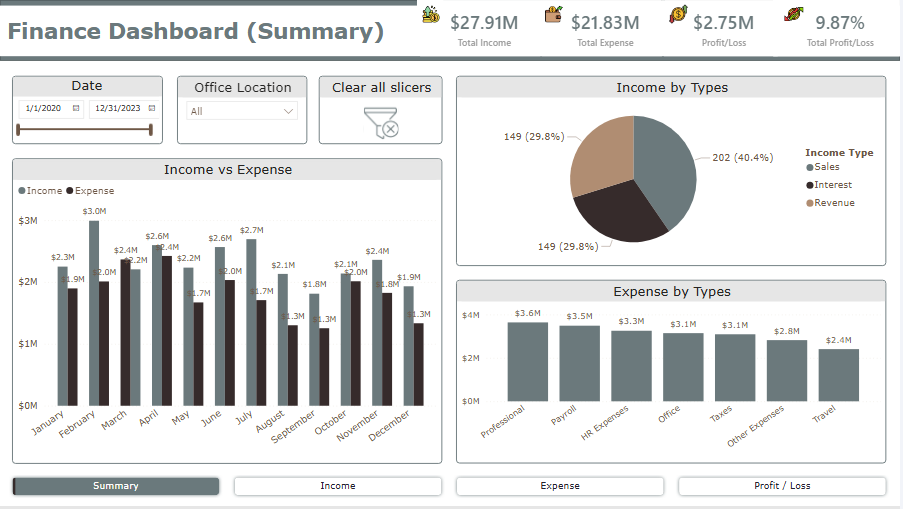
Image Source: Financial Dashboard
Key Differentiator of Tableau Finance Dashboard
Spreadsheet-based finance tools are outdated and have limitations, ranging from manual errors to the inability to track performance across diverse businesses. However, the Tableau KPI dashboards have advanced data blending capabilities that allow real-time tracking of financial KPIs across multiple business units. What it means for businesses is instant access to consolidated revenue, expense, and profitability metrics.
- Expense Monitoring: With the C-Level Tableau Dashboard’s expense tracking and budget analytics feature, leaders can effectively track expenditures, and assist teams in cost control and budgeting.
- Revenue Analysis: Financial organizations are plagued with complex revenue structures and inefficiencies. Tableau finance dashboard helps organizations break down revenue streams, and identify profitable areas, cost leakages, and help make decisions to drive financial performance.
- Financial Ratio Tracking: Profit margins, liquidity ratios, debt-to-equity, and return on investment (ROI) are some aspects that need continuous monitoring and in-depth analysis. Tableau finance dashboards help break down the complexity by providing visual insights about cash flow trends, and risk exposure, thus helping gauge the financial health of an organization.
- Forecasting: Scenario analysis is a key component of financial planning and strategy and is often overlooked and thought of as a complex task. Tableau uses predictive models that assist organizations in getting a complete view of revenue, risk factors, and budget allocation requirements, thus powering proactive financial management.
- Compliance Reporting: Financial regulations and compliance like IFRS, GAAP, Basel III, and SOX for the financial sector keep on changing and are very time and effort-intensive. C-Level Tableau dashboard makes it easier for organizations to adhere to reporting standards, risk management protocols, and anti-money laundering (AML) regulations.
Essential Metrics in a Finance Dashboard
- Revenue Growth Rate
- Expense Breakdown by Department
- Cost-to-Income Ratio
- Profitability Index
Break down data silos and disconnected data barriers and unify your data story with cross-functional dashboards powered by Tableau!
6. Marketing Performance Dashboard
The quest to understand the effectiveness and success of marketing campaigns and strategies led to the development of marketing executive performance dashboards. It has revamped the way marketers work by providing deep insight into metrics such as website traffic, lead conversion rates, customer acquisition cost (CAC), and social media engagement.
According to data from Bain & Company, marketers on average could realize 25% to 30% higher revenue for each dollar spent on advanced measurement capabilities, over the first year.
A marketing dashboard is an effective tool to measure effectiveness and can provide a trend line showing website traffic alongside lead conversions, thus indicating the effectiveness of online campaigns, or assessing the cost-effectiveness of different marketing channels.

Image Source: Marketing Performance Dashboard
Key Differentiator of Tableau Marketing Performance Dashboard
Some of the stalwarts like Google Analytics or Adobe Analytics lack in providing cross-platform marketing analysis, but Tableau interactive dashboards have these capabilities along with data drill-downs.
- Campaign ROI Tracking: ROI measurement is a cumbersome process, especially in marketing with attribution models, multi-channel impact, and customer lifetime value (CLV)being complex and intangible. Tableau measures the return on marketing investments, guiding budget allocations by visualizing campaign performance, tracking conversion rates, and analyzing customer engagement across channels.
- Audience Segmentation: Demographics-based marketing strategy goes a long way in bringing ROI and C-Level Tableau dashboards for marketing heads to do exactly this through features like geospatial analysis, customer segmentation, heat maps, and cohort analysis that analyze demographics, aiding targeted marketing.
- Engagement Metrics: Engagement metrics are often an indicator of marketing campaigns being effective or dud and Tableaus helps gauge these through real-time interaction tracking, sentiment analysis, click-through rates (CTR), bounce rates, and social media analytics, thus helping refine content strategies.
- Lead Conversion Analysis: Tableau tracks lead journeys, through its funnel visualization, lead scoring, attribution modeling, and cohort analysis, optimizing conversion strategies.
- Social Media Monitoring: Tableau has capabilities where integrating social data provides insights into brand perception, powered by natural language processing (NLP), sentiment analysis, and social listening tools, helping brands track customer sentiment and engagement trends in real-time.
Essential Metrics in a Marketing Executive Performance Dashboard
- Cost Per Lead (CPL)
- Customer Lifetime Value (CLV)
- Organic vs. Paid Traffic
- Conversion Rate by Platform
7. E-commerce & Retail Dashboard
There were approx. 1.1 billion websites in 2024, and evaluating online sales performance, customer behavior, and inventory management is critical and necessary. An e-commerce and retail dashboard provides a view of key metrics including total sales, average order value, cart abandonment rate, and inventory turnover. From funnel charts that depict the customer journey from website visits to purchases to identifying stages with high drop-off rates, an e-commerce dashboard can be particularly effective in understanding customer sentiment and behavior. Additionally, it displays the inventory turnover and helps ensure that stock levels are aligned with demand, reducing holding costs.
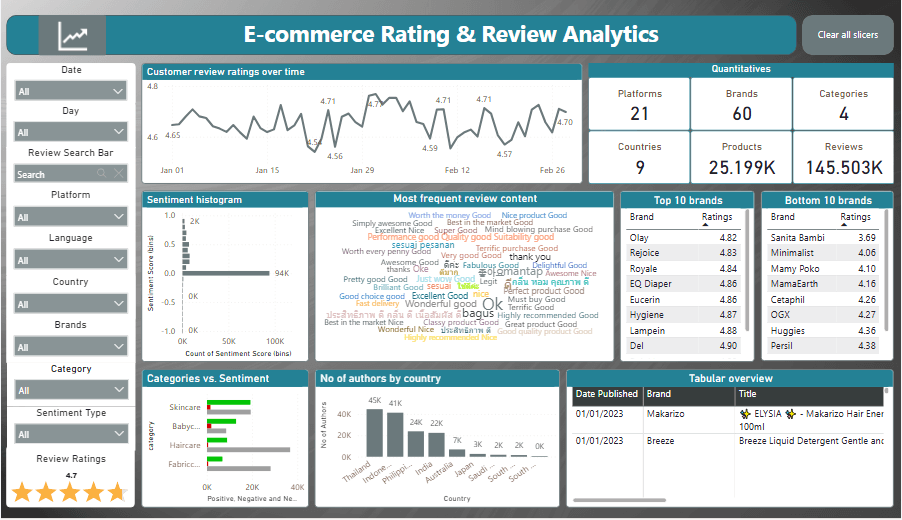
Image Source: Ecommerce Dashboard
Key Differentiator of E-Commerce and Retail Dashboard
Traditional POS and ERP reports don’t have capabilities for the integration of omnichannel retail data. However, Tableau’s e-commerce and retail dashboard enables real-time inventory tracking and personalized customer insights across channels.
- Sales Performance Tracking: E-commerce relies on monitoring sales metrics, identifying trends, and uncovering opportunities. Tableau helps e-commerce giants optimize pricing, inventory, and customer experience through real-time sales tracking, demand forecasting, and customer segmentation, driving higher conversions and revenue growth.
- Inventory Management: Inventory management has always been a prime concern, especially in the dynamic e-commerce and retail industries where demand fluctuations, seasonal trends, and supply chain disruptions create challenges. Tableau dashboards track stock levels, preventing shortages and overstocking through real-time inventory monitoring, demand forecasting, and automated restocking alerts.
- Customer Behavior Analysis: Customer preferences, behavior, and likes shift every six months and Tableau dashboards effectively capture customer sentiments through advanced sentiment analysis, real-time social media monitoring, and integrated feedback systems. They provide a complete view of purchase patterns and help define personalized marketing strategies accordingly.
Essential Metrics in an E-Commerce and Retail Dashboard
- Online vs. In-Store Sales
- Cart Abandonment Rate
- Inventory Turnover Ratio
- Customer Retention Rate
Wrapping Up
Tableau Executive Dashboards: Powering Smarter Decision-Making For Businesses
Every industry is overwhelmed with data, but it takes effective technological innovation to extract actionable insights from these complex data sets. This blog provides insight into examples of Tableau dashboards for executives that support this cause by driving real-time, fact-based decisions.
Organizations that want to use big data effectively for the growth of their organizations must use the Tableau dashboard to integrate real-time analytics and predictive modeling, for improved forecasting and market responsiveness. As data complexity and volume increase, dashboards will incorporate advanced AI and automation for deeper, faster analysis.
Partnering with seasoned Tableau consulting services with proven expertise is the way ahead for ensuring custom, efficient implementation and continuous optimization, thus directly improving operations and ROI. X-Byte, as a certified Tableau solution partner, empowers organizations to build a data-driven culture and democratize data access.
Collaborate with X-Byte Analytics to get Tableau consulting services and Tableau professional services to build a self-service analytics culture, and maintain a competitive edge against competitors.