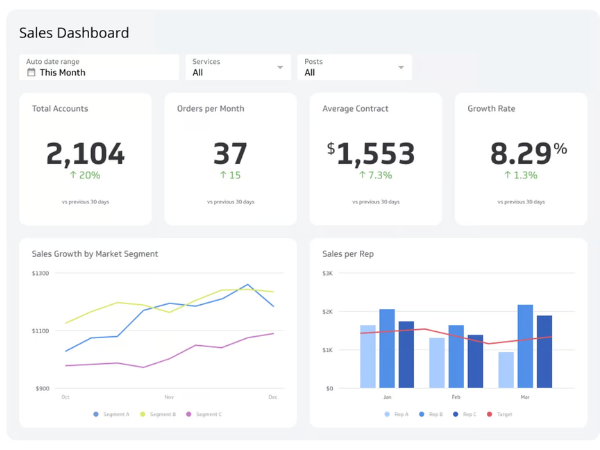


Sales Performance Dashboard
The sales performance dashboard provides a comprehensive view of the sales performance matrices, allowing users to monitor the progress of the sales goals.
Benefits of Sales Performance Dashboard
- Identifying the strategies
- Boosts accountability with KPIs
- Encourages timely adjustments
- Real-time monitoring

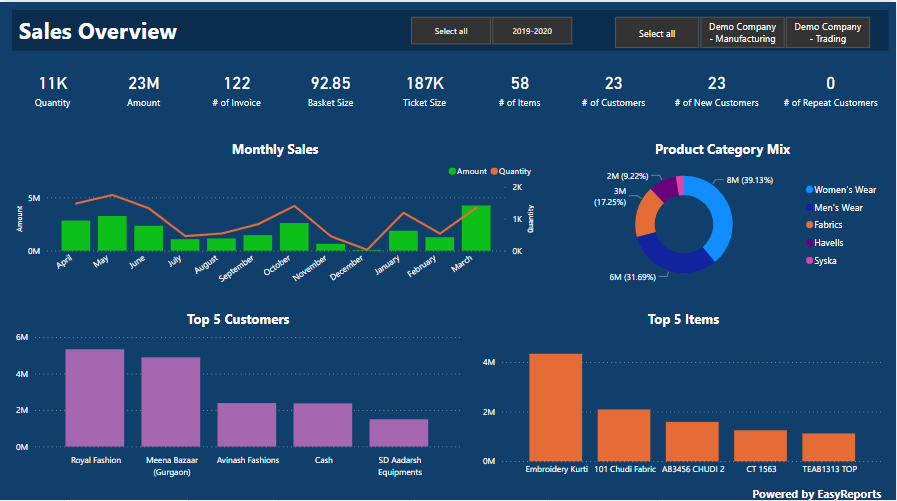
Sales Analysis Dashboard
Utilizing sales analysis dashboards to uncover trends, patterns, and crucial data insights. This assists in enhancing decision-making by providing actionable insights into sales performance.
Benefits of Sales Analysis Dashboard
- Enables better forecasting
- Ensure strategic planning
- Understanding customer preferences
- Drives better product development

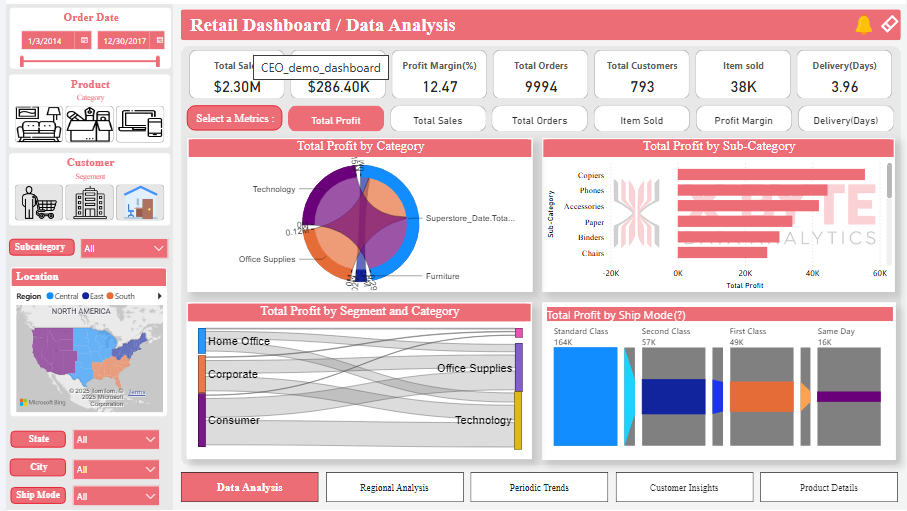
Sales KPI Dashboard
Implement the sales KPI dashboard to track the key performance indicators necessary for goal achievement of the sales department.
Benefits of Sales KPI Dashboard
- Keeps teams aligned with goals
- Boost overall efficiency
- Boosting customer retention
- Ensure revenue growth
Sales Leads Tracking Dashboard
Ensure real-time lead tracking to monitor the status and progress of sales leads throughout the pipeline. This helps improve lead management, increase conversions, and identify bottlenecks in the pipeline.
Benefits of Leads Tracking Dashboard
- Enhances conversion rates
- Focussing on improvement areas
- Tracking leads and it’s sources
- Focussing on high-potential leads

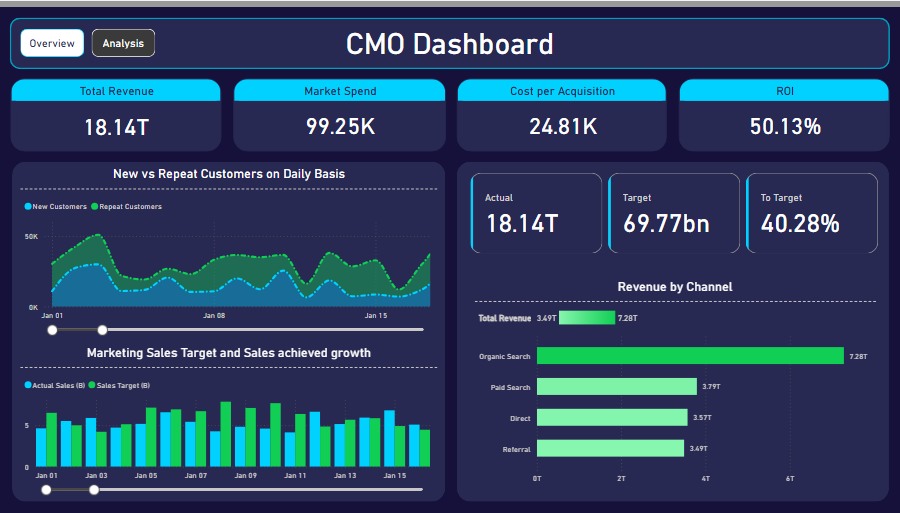
Sales Summary Dashboard
Leverage the sales summary dashboard to get an overview of sales performance for quick assessment. This will ensure informed decision-making without analyzing large amounts of data.
Benefits of Sales Summary Dashboard
- Facilitates informed decision making
- Real time performance summaries
- Highlights priority aspects
- Monitoring revenue

Sales Opportunities Dashboard
This dashboard tracks potential sales opportunities and their likelihood of closure. It allows businesses to focus on high-value opportunities and improves forecasting accuracy.
Benefits of Sales Opportunities Dashboard
- Focussing on high value opportunities
- Improves revenue planning
- Ensuring forecasting accuracy
- Identifying sales processes

Sales Manager dashboard
The sales representative dashboard is designed for sales managers to monitor team performance and overall sales effectiveness.
Benefits of Sales Manager Dashboard
- Monitoring team performance
- Drives team accountability
- Identifies high performers
- Tracking routine activities