Retail Dashboard

Trusted by conglomerates, enterprises, and startups


What is Power BI Retail Dashboard?
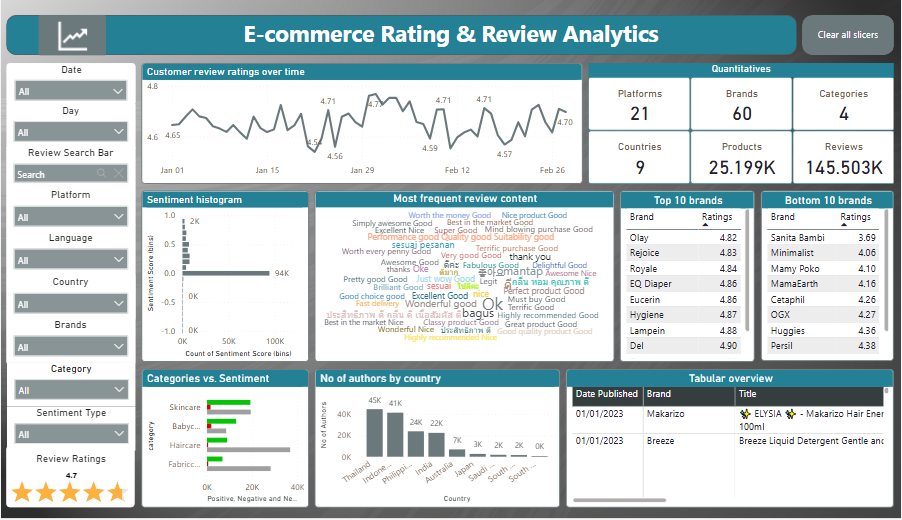
The retail dashboard is an interactive data visualization tool created for retail businesses to analyze and monitor key performance metrics. The retail business intelligence dashboard provides a clear and comprehensive view of overall performance in real time. This helps identify trends, customer demand, and inventory tracking.
The integrated dashboard for retail stores displays metrics like sales performance, inventory levels, customer demographics, and revenue growth. This helps retailers better understand customer behavior, optimize operations, and make data-driven decisions to improve profitability and efficiency.
Live Dashboard
Leverage our expertise to create user-friendly retail dashboards by integrating key insights from diverse sources.
Take Control of Your Retail Performance
Why Use a Retail Dashboard?
A Power BI retail dashboard transforms modern businesses by providing a centralized platform to seamlessly monitor, analyze, and integrate key metrics. Our experts create custom dashboards for retail stores to provide real-time performance monitoring, save time, and reduce manual efforts of compiling diverse datasets.
Presenting real-time data on sales trends, inventory levels, and customer preferences helps retailers determine market trends and areas of improvement. The custom Power BI solution for retail businesses can help boost operational efficiency by promptly meeting customer needs.

What are the Benefits of a Retail Dashboard?
Retail stores performance dashboards help businesses track real-time data for smooth analysis and for creating achievable strategies.
A retail analytics dashboard provides live updates on key metrics like sales, inventory, and customer activity. This means businesses can immediately spot trends and market opportunities.
Get a retail business dashboard integrating critical metrics like current stock levels, turnover rates, and slow-moving items. This helps in avoiding overstocking and understocking with smart inventory management approaches.
An interactive dashboard consolidates all the necessary data from diverse data sources. This saves time and reduces the chances of errors during the analysis process. This saves time from gathering data and ensures accurate decision-making.
Ensure smooth data forecasting by monitoring historical trends and current performance metrics. Accurate data forecasting helps create market-driven strategies to prepare for future challenges and opportunities.
Comprehensive Retail Dashboard Services
Transform your business operations with our comprehensive retail dashboard services. Our expertise helps us conduct real-time data analysis and improve business strategies.
Inventory Management
Benefits of Inventory Management
- Reduced stockouts
- Optimized storage costs
- Improved inventory forecasting
- Boosted customer satisfaction
Omnichannel Experience
Benefits of Omnichannel Experience
- Enhanced user engagement
- Boosted sales opportunities
- Better insights about customer behavior
- Streamlined business operations
Consumer Trends Tracking
Benefits of Consumer Trends Tracking
- Strategic decision-making process
- Targetted marketing
- Product development based on emerging trends
- Boosted revenue by meeting customer expectations
Global Store Analysis
Benefits of Global Store Analysis
- Standardized business operations
- Performance benchmarking based on set goals
- Localized marketing strategies
- Strategic expansion and cost efficiency
Store and Staff Performance
Benefits of Store and Staff Performance
- Monitoring staff performance
- Replicate successful practices
- Boost overall productivity
- Improve profitability and customer service
Retail Sales Analysis
Benefits of Retail Sales Analysis
- Determine growth opportunities
- Planning inventory and promotions
- Improves pricing strategy
- Predicts future sales performance
Store Sales Analysis
Benefits of Store Sales Analysis
- Location-specific insights
- Optimized inventory management
- Targetted marketing to improve sales
- Track store-level targets and achievements
Basket Analysis
Benefits of Basket Analysis
- Enhanced upselling opportunities
- Increased revenue through strategic product pairing
- Improved promotions
- Enhanced customer preferences
Case Studies
Boosting Marketing Campaign ROI
Overview
A retail brand experienced inconsistent results from marketing campaigns due to a lack of customer behavior insights.

Challenges
The marketing team could not measure the effectiveness of campaigns in real-time, leading to wasted resources and missed opportunities.
Solutions
The retail dashboard integrated customer data, including purchase trends and engagement metrics. With real-time feedback, the team optimized campaigns mid-run, resulting in a 25% increase in ROI.
Enhancing Inventory Management
Overview
A mid-sized retail chain struggled with inventory inefficiencies, resulting in frequent stockouts and overstocked items.

Challenges
The manual tracking system could not provide real-time inventory insights, leading to lost sales opportunities and increased storage costs.
Solutions
Implementing a retail dashboard provided real-time inventory tracking, predictive stock analytics, and automated restocking alerts, which reduced stockouts by 30%.
Audience
Get in Touch
How to Create a Retail Dashboard?
Implement a Power BI retail dashboard to automate the routine processes and ensure smooth decision-making. Our dedicated and experienced Power BI professionals provide industry-leading dashboards for enhanced visibility.

Our expert team discusses with clients to understand their project needs to create interactive retail business dashboards. This helps our experts provide user-friendly solutions that fulfill needs and help with smooth decision-making.
After analyzing the project needs and requirements, we design prototypes for the retail dashboard with the required features. The prototypes create an interactive Power BI retail dashboard with all the necessary features and components.
Once the retail analytics dashboard is built, we test its responsiveness and usability. If any bug is found, our Power BI experts resolve it and deploy the dashboard for retail stores.


