Real Estate Dashboard
Boost productivity and monitor the KPI for the real estate metrics dashboard. Businesses can boost performance and track the revenue and expenses to manage and ensure strategic planning. Our Power BI real estate dashboards provide actionable insights for managing properties, finances, and KPIs. We also offer a ready real estate dashboard suited for diverse industries.

Trusted by conglomerates, enterprises, and startups


What is Power BI Real Estate Dashboard?
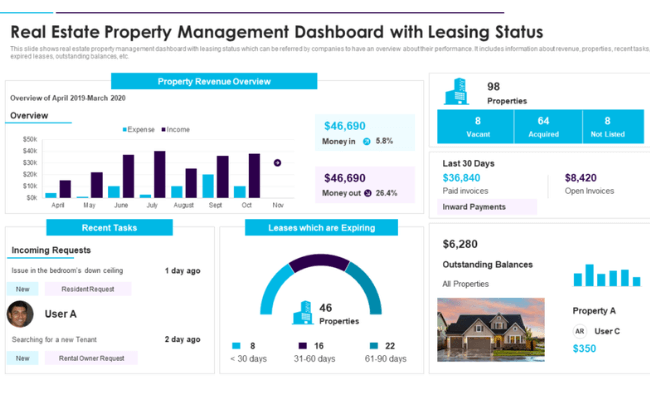
A real estate management dashboard allows you to examine your important data as it is updated in real time. X-Byte Data Analytics can help real estate organizations meet their objectives by delivering custom real estate dashboard solutions. A real estate investment dashboard. The interactive and custom real estate dashboard provides updates on properties, customized insights, and visualization of critical KPIs to manage properties smoothly.
A commercial real estate dashboard gathers all the essential data you need in one convenient place, which may simplify these tasks considerably. We integrate Power BI in the real estate dashboard to access large amounts of data on properties, sales, marketing, and customer interactions. Using a real estate management dashboard, X-Byte Analytics helps real estate agents leverage data for improved productivity and strategic growth.
Live Dashboard
Transform the data analysis process with an interactive real estate dashboard to manage diverse KPIs smoothly. Our expertise in real estate analytics dashboards assists in the smooth decision-making process.
Contact Us Today
Why use a Real Estate Dashboard?
X-Byte Data Analytics assists businesses in data-driven strategy formation to maximize the value and unleash the full potential of data. The personalized dashboard for real estate assists in enhanced portfolio tracking, risk assessment, and data-driven insights for real estate decisions.
Our Power BI real estate dashboard is designed to improve property management, sales monitoring, and customer engagement while supporting strategic decision-making. The real estate KPI dashboard improves portfolio performance by identifying potential risks and opportunities to align with business strategies.

What are the Benefits of Real Estate Dashboard?
X-Byte Data Analytics helps to track key metrics for successful property management, and data management of KPIs for smooth business performance. Our team delivers customized solutions to track key sales, property management, tenant tracking, regional sales analysis and leasing metrics with Power BI real estate dashboards.
Manage properties from various regions on a single platform to ensure real-time analysis, property condition, tenant tracking, lease duration, and occupancy rates with a real estate dashboard for property management.
Real estate dashboards allow users to track performance metrics like sales conversion rates, leasing activity, or ROI on specific properties.
Custom real estate dashboards help mitigate risks by enabling users to act proactively rather than reactively, which can prevent issues from escalating into larger problems.
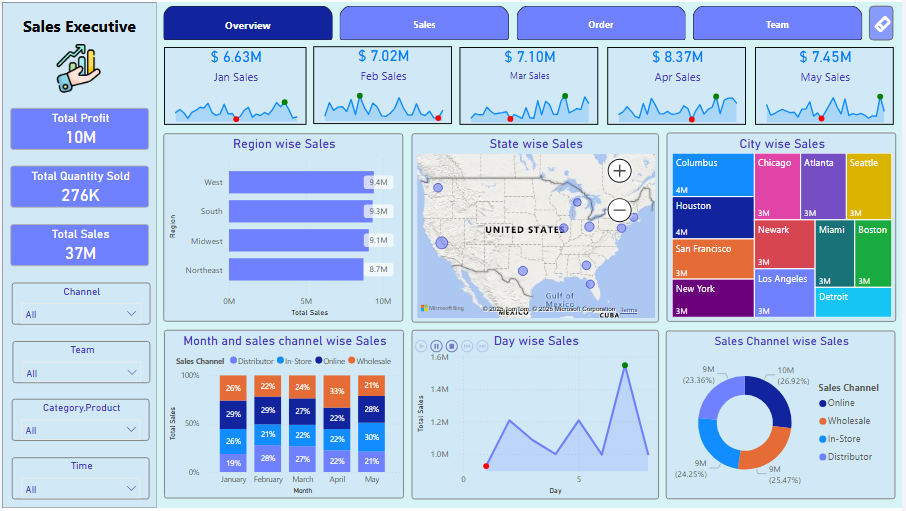
Modern dashboards present data in a visually appealing form using graphs, charts, and maps. The real estate dashboard software for realtors assists stakeholders in quickly analyzing trends without analytical skills.
Types of Real Estate Dashboard
At X-Byte Analytics, we design various real estate dashboards that help in better monitoring and managing properties. Our dashboards aid in tracking various KPIs for enhanced decision-making.
Real Estate Management Dashboard
Benefits of Real Estate Management Dashboard
- Operational efficiency
- Improved tenant satisfaction
- Monitoring property maintenance schedules
- Ensuring proactive management
Real Estate Sales Dashboard
Benefits of Real Estate Sales Dashboard
- Optimized sales strategy
- Improved lead management
- Agent performance tracking
- Monitor sales agent performance
Rental Income and Expenses Dashboard
Benefits of Rental Income and Expenses Dashboard
- Increased profitability awareness
- Expense tracking and control
- Budget planning and cash flow management
- Monitor underperforming assets
Real Estate Portfolio Management Dashboard
Benefits of Real Estate Portfolio Management Dashboard
- Investment optimization
- Diverse portfolio insights
- Smooth performance tracking
- Monitor top-performing properties
Real Estate Market Trends Dashboard
Benefits of Real Estate Market Trends Dashboard
- Strategic pricing and investment decisions
- Forecasting market trends
- Real-time market analytics
- Adjust strategies to align with demand
Tenant Management Dashboard
Benefits of Tenant Management Dashboard
- Efficient tenant interaction
- Tracking rent payments and real-time alerts
- Enhanced tenant retention
- Smooth communication with tenants
Master Your Real Estate Decisions!
Case Studies
Optimizing Portfolio Performance for a Real Estate Investment Firm
Overview

Challenges
Solutions
Boosting Property Management Efficiency
Overview

Challenges
Solutions
How to Create a Power BI Real Estate Dashboard?
Our extensive expertise helps various industrial domains collaborate seamlessly without any hurdles. X-Byte Data Analytics provides an interactive real estate market dashboard to harness the potential of business information by utilizing different tools. Our experienced team customizes the dashboard to analyze business performance.

Our professionals will communicate with clients to understand their requirements for the dashboard. Based on that, we create the strategies for custom real estate dashboard solutions and finalize the tools and techniques to build the custom dashboard.
We will create a sample design and digital prototype by utilizing advanced tools for the real estate dashboard for property management based on the finalized strategies. Once it is finalized with the clients, our team will initiate the dashboard development process by integrating Power BI for real-time adjustments.
Once the development phase is complete, we emphasize quality assurance through Power BI’s robust testing environment. Our team will deploy the solution after solving the bugs and errors in quality testing.
Our Power BI real estate dashboard development services are not limited to development and deployment. We also provide our clients with continuous support and maintenance services to ensure the dashboard functions smoothly and assist them as and when they face any difficulties.


