Quick Summary
Power BI can boost both residential and commercial real estate data analytics. Power BI dashboards help real estate industry stakeholders make smart decisions toward site selection, lease negotiations, and portfolio optimization. Investment Analysis, property management, price research, broker performance metrics, and rental property analysis are the best use cases for implementing Power BI analytics in real estate.
Real estate companies acquire or develop residential and commercial properties. For making key decisions related to investment, location, property evaluations, and market dynamics, they simply cannot rely on Excel-based analytics. Even the brokers or real-estate analysts hired by real-estate organizations find it difficult to create proper data analytics workflows. Spreadsheets can be a curse—a tangled grid of numbers that hide critical insights.
The solution?
Embrace Power BI, a power toolkit in the sphere of real estate analytics. Power BI in real estate transforms complex real estate information into understandable, crystal-clear, actionable insights with only a few clicks.
This article details how Power BI makes real analytics and interpretation super easy with its intuitive and feature-rich interface.
How Power BI Revolutionises Real Estate Analytics?
ower BI is beyond just a business intelligence tool—it’s a revolution, changing the course of how the real estate industry functions.
It transforms unprocessed, unstructured datasets into clear visual dashboards, uncovering patterns and opportunities that are otherwise hidden. From identifying undervalued properties to optimal pricing strategies and real estate management—Power BI provides professionals with influential real estate data analytics to play well in the present competitive environment.
- The global real estate market is set to reach a value of US$654.39 trillion by 2025.
- The Residential Real Estate segment leads this industry, with projections showing it will hit a market volume of US$534.37 trillion in the same year.
- The global Commercial Real Estate market will reach a value of US$120.02tn by 2025.
(Source: Statista)
With such exponential growth on the horizon, using modern business analytics and data visualization tools like Power BI becomes key to staying competitive in the sector.
Let’s see how Power BI favors the real estate industry with its unique competencies:
1. Increasing Role of Data in Real Estate
Real estate is no longer just about location—it’s more about data. From property valuations to market trends, big data analytics for real estate boosts insights through:
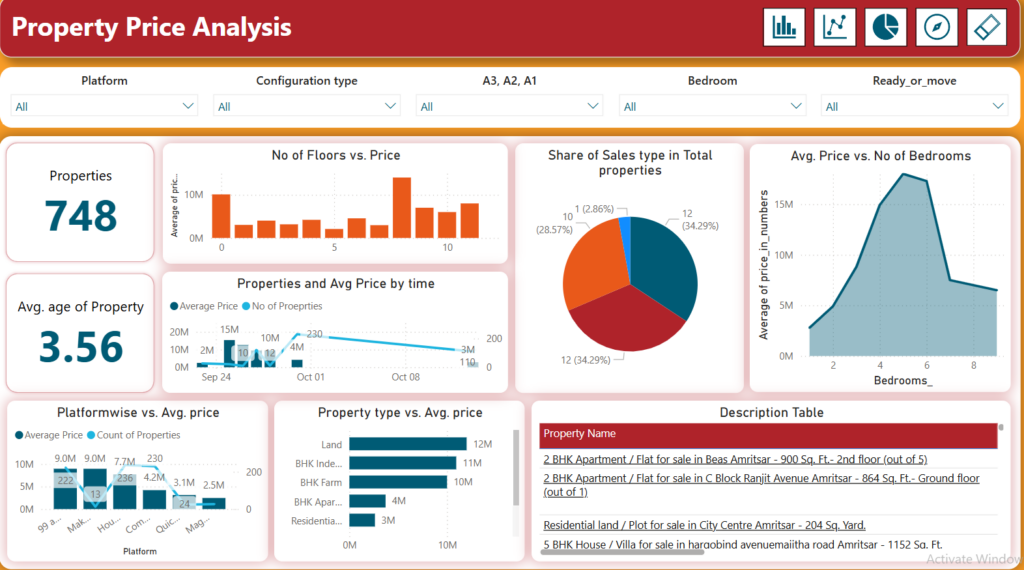
- Property Value Indicators: Understanding appreciation, depreciation, and fair market pricing. See below how a real estate dashboard powered by Power BI depicts the key price indicators and metrics.
- Demographic Trends: Gaining an insight into buyer preferences, migration patterns, and demand shifts.
- Economic Issues: Scrutinizing interest rate movements, inflation, and employment rates.
- Market Dynamics: Spotting the next big investment hotspots and trends in rental yield.
With so much data analytics at play, spreadsheets and outdated reports can no longer suffice. That’s where Power BI consulting takes the lead—assisting real estate professionals in making sense of complex data via interactive analytics and visualization features.
2. Turning Data into Actionable Insights
Power BI reflects a paradigm shift in real estate analytics. As a ‘not just another business intelligence tool,’ it provides:
- Dynamic Dashboards: Receive ongoing insights into market trends and property performance.
- Predictive Analytics: Forecast price movements and investment opportunities.
- Automated Reporting: Remove manual analysis and speed up decision-making.
For instance, family office firms managing large-scale real estate portfolios need heavy data-driven analytics to streamline their investments. Power BI eases this workflow by offering clear, data-oriented decision-making tools.
3. Bridging the Digital Gap in Real Estate
Many real estate firms experience a significant technology gap not because they don’t see the value but because they lack the right tools. Common challenges are:
- Limited investment in digital solutions leads to inefficiencies and slow decisions.
- The absence of AI-powered analytics leads to missed market opportunities.
- Weak cybersecurity frameworks expose risks to sensitive financial and property data.
Power BI sorts these issues by acting as a secure and intelligent real estate analytics platform offering insightful rental property analytics—from portfolio performance tracking to spotting new opportunities, turning data into a competitive advantage for real estate experts.
Take the first step towards real estate analytics excellence! Get developed a custom Power BI real estate dashboard!
How to Implement Power BI for Real Estate Data Analytics?
Traditional spreadsheets are like trying to cross a city with an outdated map. Yet, the real estate industry is slow to modernize.
As per Deloitte, 60% of real estate businesses still employ spreadsheets for time reporting, 51%—for property valuations and cash flow analysis, and 45%—for budgeting and forecasting.
Power BI acts as your real-time GPS, finding you the best routes and avoiding pitfalls in the real estate trajectory. An interactive real estate dashboard allows organizations to move through the dynamic landscape with agility and spot-on strategies.
Now, let’s delve into learning how you can use Power BI’s features to optimize your real estate analytics to ultimately make well-informed decisions.
Step 1: Data Preparation: The Foundation of Insightful Analysis
Data preparation is the first step to unlocking the power of Power BI. It entails loading diverse datasets into Power BI in a manner that ensures the data is clean, consistent, and all set for analysis. Let’s begin with a simple example—using an Excel datasheet for property information. Use the “Import data from Excel” option in Power BI to load your dataset. Once loaded, you will likely need to transform the data. You might need to remove unnecessary columns, correct errors, standardize formats, etc. All these are doable through “Power Query Editor” in Power BI.
For example, you may have property size, location, number of bedrooms, and sale price as columns. The best bet about Power BI is that any changes you make in this dataset are saved under the “APPLIED STEPS” pane, letting you retrace your steps and apply the same transformations in other datasets without wasting time and ensuring continuity.
Step 2: Creating Interactive Visualizations
Once your data is prepared, the next stage is designing interactive visualizations that turn the data into lively story-telling. Power BI comes with an entire spectrum of visualization options that include charts, graphs, maps, and tables, among others. With ease, you can drag and drop fields from the dataset onto the visualization canvas while creating thought-provoking representations of the data. For instance, show property prices for locations on a map or compare trends for sales over time using a line chart.
It might be a good idea to start making transformations into new columns of the current data to provide some more analysis-aligned ideas. For example, a new column can be introduced to categorize property based on distance to amenities or convert the price into price per square foot.
Consider applying conditional formatting for the “waterfront” and “condition” columns for properties to come out with a specific highlighting property. It is noticeable how well that will be acknowledged with Power BI through the “APPLIED STEPS” pane. Average assessed value, average sale amount, and average sale ratio will pretty much tell you everything about your data.
Step 3: Designing the Dashboard: Aesthetics and Functionality
A well-structured and designed real estate dashboard is the core feature to share data effectively. It should be visually appealing, user-friendly, and easy to use. To begin, create a template with a striking and professional layout. Use shapes, change colors, rotate elements, add borders and shadows, and text to improve the visual aspects. Adding backgrounds can further enhance the aesthetics of your real estate dashboard. Just remember to place the visuals logically, with the base information standing out.
Employ clear and concise labels, tooltips, and legends so users can interpret the data better. Incorporate filters and slicers so that users can interact with the data and drill down into specific areas they prefer. The key is that your dashboard should let users cut through the noise and access relevant information for quick decision-making.
Step 4: Integrating Advanced Analytics and Measures
The advanced analytics and calculations are what give Power BI its true worth. Using Power BI’s formula language—DAX (Data Analysis Expressions), create custom measures and calculated columns to yield hidden insights from your data.
For example, you can use DAX formulas to find the total number of properties and the properties that have a waterfront view. Such functions involve the use of COUNTROWS and FILTER features. Once you have calculated these measures, choose the right visualization, say, a card, to present these measures. Power BI lets you analyze property features—the number of bedrooms, the year the property was built, or its condition by applying filters. For property management analytics, these advanced measures strongly help elevate operational efficiency and tenant satisfaction.
Step 5: Connecting the Pieces: Relationships and Navigation
In real estate projects, the data tend to be scattered across multiple tables or datasets. With Power BI, you can connect such tables through relationships to build a single data model. This allows you to perform analyses that span multiple datasets, thus providing a more complete picture of your business. Relationships are built on common fields between tables, such as property IDs or dates. This creates the possibility of complex queries and visualization of results that combine data from different sources.
Suppose there is a table with general information about the property and another with sales data. These tables would be linked for analysis to see how the characteristics of the property play into sales performances. Moreover, interconnecting different dashboard pages to facilitate navigation is very important. Select “Page Navigation” to point to the desired page, thus enabling intuitive passage for users along the dashboard. It is also important to maintain and scale the database without affecting performance; therefore, linking tables with the fact table is a must. A solid data model is the backbone of useful real estate analytics.
Build real estate Power BI Dashboards that enable smarter investment decisions and drive profits!
Power BI Dashboard for Real Estate Analytics
Power BI dashboards prove to be an invaluable tool for real estate analytics, offering comprehensive insights and data visualization capabilities.
Here’s how Power BI Dashboard delivers real estate analytics:
- Centralized View: Power BI development makes it possible to build a central dashboard with a comprehensive view of all real estate analytics in one place. This dashboard gives a complete look at company numbers, how agents and brokers are doing, marketing insights, and financial matters. The main screen of the dashboard shows key info at first glance. You can click to expand and dig deeper into specific parts.
- Live Performance Updates: The quick stats section displays key numbers like deals in progress, total deal amounts, this year’s deal sums, and expected net profits. On the company performance page, you can track deal counts and totals for each agent or broker.
- Smart Filtering and User Interaction: Users can filter data by clicking specific elements, allowing them to focus on certain agents, deals, or periods. This interaction gives quick insights and lets users compare different parts of the business.
- Deal Management and Progress Tracking: The active deals page shows an overview of checklist items and tasks for each deal. This feature helps to monitor deal progress and spot any hold-ups in the process.
- Agent Performance Analysis: The agent performance page gives insights into how individual agents or brokers are doing. It includes maps of agent territories and deal types (listings, sales, rentals).
- Marketing ROI Analysis: The marketing analysis page connects to related marketing efforts. It helps evaluate how well buyers and sellers market themselves, which can improve marketing plans.
- Financial Forecasting and Management: The cash flow forecasting tool predicts when checks will arrive based on expected deal closings. The expense overview page shows different types of costs over time. The company financials page gives a simple look at income and expenses, with options to see more details in real-world setups.
- Customization and Flexibility: Real estate companies can adjust the dashboard to fit their unique needs and data structures. This makes the analytics adaptable.
Conclusion
The transition to Power BI dashboards is changing how real estate organizations compete in the present world. Master complex data preparation, create dynamic visuals, and work with predictive analytics in real estate to evolve the data maze into actionable information. Whether you’re an investor, property manager, or real estate agent, Power BI equips you to make educated decisions that pave the way for growth.
Learn how to turn hefty datasets into real intelligence with Power BI at X-Byte Analytics—strategize your real estate game and reach larger investors with the real estate analytics power package—all at your fingertips now.