Quick Summary
Business intelligence is a key differentiator that provides unique capabilities to organizations and modern enterprises. The power to make data-driven decisions is what separates the leaders from the laggards. In this context, the most popular business intelligence tools are Power BI, QlikView, and Tableau. However, considering the immense capabilities, features, and traits of these tools, it is difficult to settle on the right one for your needs. Therefore, this comparison guide delves into the intricacies of Power BI vs Tableau vs QlikView, providing you with the ultimate comparison to inform your BI strategy for 2025 and beyond.
Organizations in the mid-80s and early 90’s had to rely on spreadsheets and sales reports to tackle the data they produced and make sense of it. But as organizations scaled, these outdated ways of managing data led to inconsistent reporting, data silos, slow decision-making, and missed growth opportunities.
This was the time when Gartner introduced the term “Business Intelligence,” and IBM and Siebe introduced the first comprehensive Business Intelligence (BI) systems.
These tools proved to be an excellent solution for organizations overwhelmed with critical data-related pain points like data fragmentation, reporting delays, scalability issues, lack of data-driven insights, and predictive analysis.
Today, Microsoft Power BI, Tableau, and QlikView lead the BI tools market, each with its own set of capabilities, including advanced data visualization, AI-powered analytics, real-time reporting, self-service BI, and robust data integration. But if you are an organization contemplating which among these to choose, we have the answers.
Our team of BI experts and data analysts at X-Byte have worked with all three of these for clients, and we bring our very own insights on the BI tool comparison of Power BI vs Tableau vs QlikView based on their strengths, use cases, and best-fit scenarios
What are Business Intelligence (BI) Tools?
BI tools or business intelligence tools are software applications that are used particularly by businesses to automate and quicken accurate decision-making, using a combination of data integration, analytics, and visualization technologies.
In a nutshell, a BI tool eliminates errors and, time delays, and manual work involved in deciphering data by pulling data from databases, CRMs, ERPs, spreadsheets, APIs and transforming them into tangible structured formats.
Overview of Power BI vs Tableau vs QlikView For Business Intelligence
Power BI, Tableau, and QlikView are the most used BI tools, and McKinsey’s report emphasizes the need for program governance teams to use Power BI, Tableau, and QlikView for their ability to pull data using different connection methods. Though the Power BI vs Tableau vs QlikView debate is a regular, organizations can look at their individual need and perform BI software comparisons for each of these powerful BI tools to assess which suits them the best.
What is Power BI?
Power BI is Microsoft’s project and one of the leading BI platforms, launched in 2015 to help businesses analyze, visualize, and share data interactively without requiring advanced technical expertise. As of 2024, Microsoft Power BI leads the business intelligence market with a 17% share, positioning it ahead of Tableau competitors.
Power BI stands out for its easy integration with existing Microsoft products, which includes Excel, Azure, and SQL Server. It has been further upgraded to include AI-powered analytics for deeper insights, real-time dashboards, reporting, self-service BI capabilities, and cloud & on-premise deployment options.
What is Tableau?
Tableau is a Power BI equivalent and one of the major Power BI competitors, along with QlikView the idea of which idea was conceived by a team of three at Stanford University back in 2003 and was then acquired by Salesforce in 2019. The idea behind Tableau Consulting is to make data analysis faster and more intuitive using visual-based exploration. Tableau stands out for its best-in-class data visualization with interactive dashboards, easy drag-and-drop interface, and capability to handle large datasets and support multiple data sources.
What is QlikView?
QlikView was first released in 1994 as an alternative to Tableau software to enable businesses to explore and analyze data dynamically using an associative data model, which was unlike the other tools being developed then which were based on traditional query-based approaches. Qlik, along with SAP and IBM have been long-standing Tableau competitors in the business intelligence market.
QlikView is a software like Tableau and is used widely for its associative data model for flexible, non-linear data exploration, in-memory processing for fast analytics, self-service BI with interactive dashboards, advanced data visualization & ETL capabilities, and customizable & script-driven for deeper insights.
Note: QlikView® continues to be utilized by companies; however, it is no longer promoted to new clients. (Barc). Qlick now promotes Qlik Analytics instead.
Power BI vs. Tableau vs QlikView: BI Tool Comparison
The potential and market prowess of PowerBI, Tableau, and QlikView can be gauged by Gartner’s Magic Quadrant for Analytics and Business Intelligence Platforms for 2022, which puts these three among the leaders.
Let’s look at the features of Power BI, Tableau, and QlikView, capabilities, and pros and cons of Tableau, Power BI, and QlikView so that you can decide between these three for your business.
Breakdown of Power BI Features
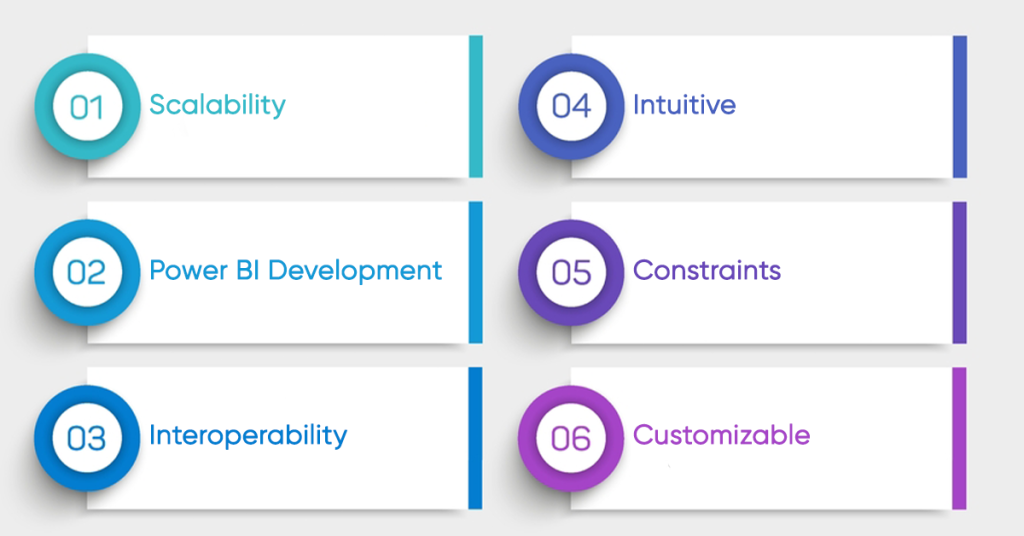
- Scalability: For Microsoft, the Power BI tool was an organic future-centric extension to its Excel software and an expansion for the MS Office. Since most organizations had their employees working on MS Office by then, switching to Power BI became an organic transition.
- Power BI Development: With Power BI, connecting to various data sources, transforming and modeling data, and creating interactive visualizations becomes easier by partnering with certified Power BI consultants. The right Microsoft Power BI Consulting Services like X-Byte use best practices to ensure efficient and effective reporting, and competent Power BI developers focus on building scalable and maintainable reports and dashboards.
- Interoperability: With Power BI, you can form smooth connections to various types of platforms like platforms like SQL databases, Excel spreadsheets, cloud services, and big data environments. With this, you can achieve an easy integration of data from on‑premises sources and cloud-based services All this is thanks to Microsoft Power BI’s built‑in connectors, which simplify data ingestion.
- Intuitive: Power BI boasts of a drag-and-drop look and a pre-built template for charts that allow users to have a grid view for precise measurements.
- Constraints: One of the cons of Microsoft’s Power BI is that it runs only on Azure, which is Microsoft’s public cloud computing platform.
- Customizable: Power BI leads the three with its classic visualizations and customization options that create uniqueness in dashboards with custom visuals marketplace, charts, and custom design.
Simplify BI Implementation for a Data-Driven Future! Avail of X-Byte Analytics’s Power BI Consulting Services!
Key Differentiators of QlikView
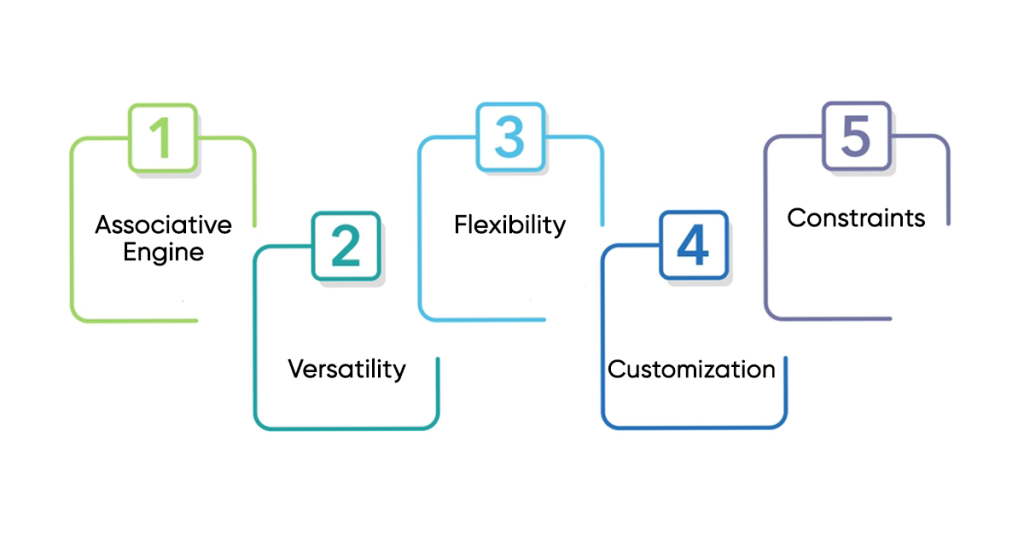
- Associative Engine: Qlikeview runs on the Qlik Associative Engine, which provides fast, in-memory data processing and associative data indexing. This is a potent tool that allows users to explore data dynamically and navigate data freely without being restricted to predefined hierarchies or queries. Qlik is used by businesses that want cloud-based and on-premise flexibility.
- Versatility: Qlik has traditional charts and tables and customization for a wide range of activities that include presentation styles.
- Flexibility: Deployment of QlikView offers a lot of flexibility where companies can use it with most of the cloud providers, and it can be deployed on-premises. This is a major advantage for companies as they don’t have to change from one cloud to another or modify their analytics strategy, making QlikView a leading BI platform.
- Customization: Qlik brings with it the power of complete customization and flexibility, and the native connectors display the sources that are sought-after by customers, along with the flexibility to download through the Qlik website.
- Constraints: One of the concerns of QlikView is the lack of support for e-commerce and payment processing platforms, which is considered detrimental to data analysis. Another minus is the need to know coding to make custom dashboards because of the lack of easily accessible customization options.
Tableau’s Distinct Advantages
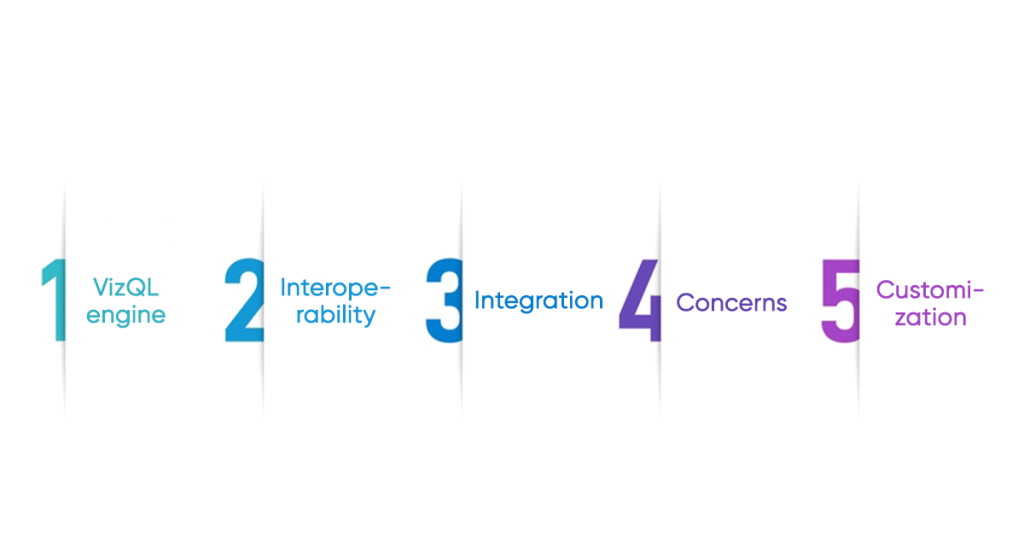
- VizQL engine: Tableau, acquired by Salesforce in 2019, is known for its large demo library, and user-friendly visualizations tilt the scale in its favor. Tableau uses the VizQL engine, which speeds up dashboard sharing. The drag-and-drop interface makes it a hit among non-technical users and makes it an easy addition for organizations.
- Interoperability: Tableau helps companies make the best use of their data through Tableau Server/Tableau Cloud, where organizations can connect to diverse data sources, prepare and blend their data, and then publish interactive dashboards and visualizations for widespread sharing and collaboration.
- Integration: Tableau provides the exceptional benefit of integration with varied sources and data connectors which include Amazon Redshift, Microsoft Excel, Google Analytics, SAP, Snowflake, and Salesforce.
- Concerns: The one thing that doesn’t go in the favour of Tableau is its lack of special connections for project management, payment processing, or e-commerce platforms, and it relies heavily on third parties to connect with and establish these missing connections. Another disadvantage of Tableau is that chart creation is tedious, with work involved in populating columns and rows sections. Tableau then analyzes and offers suitable charts according to the dimensions, that too in separate sheets, which can be used to build dashboards, which is a rather tedious and time-consuming process.
- Customization: Tableau is used for its unique-looking dashboard that has options to use custom images and icons. Users get the advantage of adjusting charts, freedom of customization, images, etc, making Tableau one of the leading BI platforms.
Overview: Power BI vs Tableau vs QlikView
| Features | Power BI | QlikView | Tableau |
| Ease of Use | Smooth transition from Excel and MS Office | Dynamic data exploration without predefined hierarchies | Drag-and-drop interface for non-technical users |
| Data Connectivity | Connects to SQL, Excel, cloud, and big data sources | Works with multiple cloud providers and on-premises | Connects with Redshift, Excel, Google Analytics, SAP, Snowflake, Salesforce |
| Customization | Drag-and-drop UI with pre-built templates | Native connectors and flexibility for custom downloads | Unique dashboards with custom images and icons |
| Deployment | Runs only on Microsoft Azure | Can be deployed on-premises or with various cloud providers | Supports sharing and publishing via Tableau Cloud/Tableau Server |
| Limitations | Tied to Azure; limited cross-platform flexibility | Lacks eCommerce/payment processing support and requires coding for dashboards | Chart creation is tedious and time-consuming. |
| Visualization Strength | Offers a custom visuals marketplace | Provides charts, tables, and varied presentation styles | Custom charts, images, and icons for enhanced dashboard aesthetics |
Pricing Comparison:
Pricing of Power BI vs Tableau vs QlikView:
If pricing is your deciding point, then the data about the pricing of Power BI vs Tableau vs QlikView shows that Power BI pricing plans offer a free version, and its Pro version starts at $10 per user per month, and other affordable premium plans come at $20. For more advanced features, you need to get the custom plans. Tableau’s pricing starts at $15 per user per month and goes higher for custom plans. QlikView pricing is available at $30 per user per month and has more advanced plans that cost more.
Get BI intelligence for your organization’s data analytics and visualization needs with interactive dashboards and real-time insights! Hire X-Byte for Power BI development services!
Which is Better: Power BI, Tableau, or QlikView?
While each holds a unique plus point, the choice of the tool depends on a lot of factors which include a complete analysis of the pros and cons of Tableau, Power BI, and QlikView. If you already have Microsoft products in your enterprise ecosystem, it’s best to have Power BI for its user-friendly interface and cost-effectiveness.
However, if it is the advanced data visualization platform that you seek then Tableau stands out with its industry-leading interactive visuals and extensive customization options. But it comes with high licensing costs.
In cases where crisp data analytics is the priority, QlikView is a strong contender, excelling in handling large datasets and providing powerful data exploration features. However, QlikView requires a steeper learning curve and more technical expertise to fully leverage its capabilities
Wrapping Up
Implementing Business Intelligence (BI) tools within a complex organizational ecosystem can be challenging without the right expertise. Partnering with experienced partners who excel at data analytics consulting can simplify this process.
At X-Byte Analytics our services such as Tableau Consulting, Power BI Development, and Microsoft Power BI Consulting transform complex data and simplify data interpretation, enabling businesses to make informed decisions.
Connect with our BI consultants to drive strategic growth.
Reach out to X-Byte Analytics today!