


IT Operations Dashboard
Understand the pulse of the customer, intricacies of business revenue, and real-time view of projects with the IT operations dashboard.
Benefits of IT Operations Dashboard
- Real-time IT infrastructure monitoring
- Automated incident detection
- Cost optimization
- Detects unauthorized access

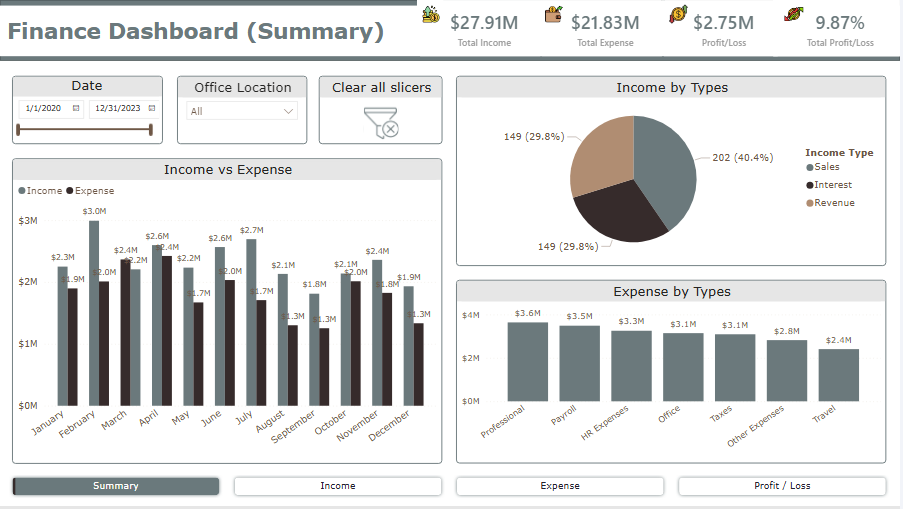
Finance Operations Dashboard
Visualize key financial metrics like balance sheets, profit/loss, and cash accounts, on a single platform and get reports on them through the finance business intelligence dashboard.
Benefits of Finance Operations Dashboard
- Cash flow monitoring
- Budget tracking
- Profitability analysis
- Regulatory compliance
- Risk management

Management Dashboard
Gain a minute understanding of team performance and tangible insights into project status with executive dashboards.
Benefits of Management Dashboard
- Visibility into key metrics
- KPI Tracking
- Forecasts risks, and identifies growth opportunities
- Reduces inefficiencies

HR Operations Dashboard
Empower HR teams by providing a visual representation of employee attrition, payroll, time to hire, absenteeism rate, and training & development progress with the HR operations dashboard.
Benefits of HR Operations Dashboard
- Monitors attendance, task completion rates
- Tracks hiring, turnover rates, and employee engagement
- Ensures adherence to labor laws, monitors grievances
- Tracks workplace satisfaction

OKR Dashboard
Ensure that all stakeholders are on one page with OKR dashboards that help in goal alignment, and progress tracking, and ensure transparency.
Benefits of OKR Dashboard
- Visibility into company, team, and individual OKRs
- Tracks measurable outcomes with dynamic progress bars
- Enhances ownership
- Identifies bottlenecks, trends, and areas for improvement

Production Dashboard
Ensure that all stakeholders are on one page with OKR dashboards that help in goal alignment, and progress tracking, and ensure transparency.
Benefits of OKR Dashboard
- Visibility into company, team, and individual OKRs
- Tracks measurable outcomes with dynamic progress bars
- Enhances ownership
- Identifies bottlenecks, trends, and areas for improvement