Quick Summary
Power BI and Power Automate from Microsoft are powerful business apps that play key roles in data analytics & visualization and workflow automation. Power BI turns raw data into lively visuals and offers AI-boosted analytics. It’s great at making dashboards, and reports, and keeping an eye on real-time data. Power Automate focuses on making processes run smoother and automating workflows on different apps and platforms work together.
Microsoft’s Power BI and Power Automate, both parts of its power apps, need no introduction. The business world has benefited greatly from the features, modules, and add-ons that these two applications offer. However, for the uninitiated, these apps may look similar. But in reality, they are different. Both Microsoft Power BI and Power Automate have distinctive functions and use cases.
This article details the difference between Microsoft Power BI and Power Automate.
Power BI: Transform Data into Insights
Microsoft’s Power BI product has become a significant buzzword in the world of business intelligence. Many people are curious about its advantages over Excel and what makes it special. Power BI, while sounding technical, is actually a self-service business intelligence tool that works by providing users with tools to create visually appealing reports. Instead of wading through dull, dry numbers, Power BI offers interactive visual representations of data.
Power BI automation serves as a full-featured business intelligence (BI) tool. It takes data from different places and turns it into clear, eye-catching, and easy-to-use insights. This platform lets people link up to data sources without hassle. It helps them see and find what matters. Users can then share these findings with some or all members of their company. Whether you’re creating reports for management or making decisions based on these reports, Power BI provides an interactive platform to gain greater insights into your results.
Microsoft launched Power BI in 2013 as part of SQL Server Reporting Services. Users loved it because it turned complex data into eye-catching interactive reports. Since then, Power BI has seen big improvements. In 2015, Microsoft rolled out Power BI Desktop. They've also kept adding new features and ways to connect more data.
One of Power BI’s key strengths is its ability to pull data from multiple sources. It can connect to over 70+ different data sources, including SAP, Oracle, various data warehouses, Excel files, and even websites. This list of connectors is continuously growing, offering more flexibility in data integration.
Next, data cleaning is often a time-consuming task, but Power BI simplifies this process with its Query Editor tool. You can clean your data once, and Power BI will remember these steps for future use. Once your data is prepared, you can create reports and dashboards containing visualizations. These are the next generation of graphs, offering incredible interactivity–users can explore the data dynamically.
A key advantage of Power BI is its cross-device compatibility, enabling you to view reports on your phone, tablet, or computer, making it ideal for meetings and on-the-go analysis. If you’re concerned about needing technical expertise to use Power BI, rest assured that it’s designed to be user-friendly. While Excel experience can be helpful, it’s not a prerequisite. Power BI offers more advanced and flexible charting options compared to Excel.
One of Power BI’s coolest features is its AI intelligence. The “Quick Insights” tool can look at your data and make different charts on its own. This helps you see your data in new ways you might not have thought about. Overall, Power BI gives you a strong easy-to-use platform to create lively, eye-catching reports and dashboards. It can connect to many data sources, save you time, and use AI to find insights, making it great for today’s business intelligence needs.
Key Features of Power BI

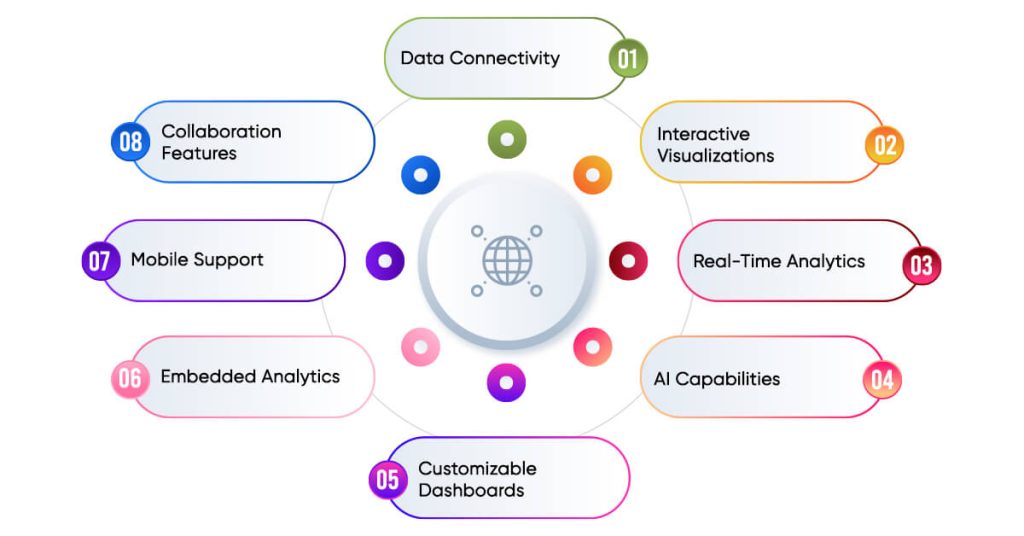
- Data Connectivity: Power BI has connections to many data sources. These include Excel spreadsheets, databases on-site, sources in the cloud, and big data.
- Interactive Visualizations: It gives users many tools to visualize data. With these, you can make dashboards, reports, charts, graphs, and maps that people can interact with.
- Real-Time Analytics: Power BI lets you see data as it comes in. This means you can get insights right away.
- AI Capabilities: Power BI uses AI to help users get their data ready, build models that learn, and understand both organized and messy data.
- Customizable Dashboards: Users can make their own dashboards. These dashboards update on their own as new data comes in.
- Embedded Analytics: Power BI has an impact on custom applications. It lets companies put data experiences into their products.
- Mobile Support: People can look at Power BI dashboards and reports on their phones and tablets. There are apps for Windows iOS, and Android.
- Collaboration Features: It’s easy to share reports and dashboards with others in a company.
Use Cases for Power BI
- Financial reporting and forecasting
- Sales and marketing analytics
- Customer behavior analysis
- Supply chain analytics
- Real-time performance monitoring
- Marketing campaign effectiveness tracking
- Human Resources (HR) analytics
- Quality control visualization
- Healthcare analytics
- Education sector analysis
- Inventory visualization
- IT Network performance analytics & reporting
- Social media and web analytics
- Consumption pattern analysis
- Demographic trend analysis
- Risk management and compliance
Want real-time business intelligence with interactive dashboards? Leverage X-Byte Analytics' Power BI development services!
Microsoft’s Power BI product has become a significant buzzword in the world of business intelligence. Many people are curious about its advantages over Excel and what makes it special. Power BI, while sounding technical, is actually a self-service business intelligence tool that works by providing users with tools to create visually appealing reports. Instead of wading through dull, dry numbers, Power BI offers interactive visual representations of data.
Power BI automation serves as a full-featured business intelligence (BI) tool. It takes data from different places and turns it into clear, eye-catching, and easy-to-use insights. This platform lets people link up to data sources without hassle. It helps them see and find what matters. Users can then share these findings with some or all members of their company. Whether you’re creating reports for management or making decisions based on these reports, Power BI provides an interactive platform to gain greater insights into your results.
Power Automate: Expedite Processes with Automation
Power Automate, (formerly Microsoft Flow), is a service that runs in the cloud. It lets users build and oversee automated workflows across different apps and services. This tool makes it possible to automate repetitive tasks, key business processes, and how information flows, without needing to write a lot of code. Power Automate aims to make tasks and business processes run smoother through automation. It can do many things, from simple jobs like sending emails to trickier ones like uploading documents with specific triggers.
One of its main strong points is that Power Automate flows can create workflows that work with many different applications. For example, you can set up an automatic task to tweet when you post on Instagram. Power Automate has a big library of default connectors to many apps. This lets users create workflows that bring different platforms together. If a specific connector isn’t there, Power Automate lets you link to apps using third-party API tools. This gives you the freedom to create ‘n’ number of workflows.
Power Automate, originally launched as Microsoft Flow in 2016, has a shorter but equally impactful history. It was rebranded as Power Automate in 2019, reflecting its integration into the broader Power Platform.
Power Automate can handle both personal and work tasks. You can make simple workflows to send alerts or emails. You can also create more complex, work-related processes. These might include approving documents, managing holiday requests, or processing invoices. The main idea behind Power Automate is to get rid of repetitive tasks through automation.
It’s worth noting that Power Automate has the ability to include human input in its workflows. Take a document approval process as an example. You can set it up to need people to step in at key points. This feature makes Power Automate useful for things like handling invoices. In this case, you might want to set up a system where approvals depend on how much the invoice is for.
Power Automate can provide an easy-to-use, no-code place to create automation. With hundreds of ways to connect, it can work with lots of apps and services. Users can build complex processes with advanced rules, conditions, loops, and ways to get approval. Once made, these processes can be shared with team members or coworkers.
The tool’s power lies in its ability to handle complex logic. For instance, you could create an invoice processing workflow that automatically approves invoices under $100 but requires manual approval for those exceeding this amount.
You can also automate tasks between different Microsoft services like Outlook and OneDrive, or even between competing platforms like Gmail and Outlook. It also supports automation with external systems such as Salesforce.
Key Features of Power Automate

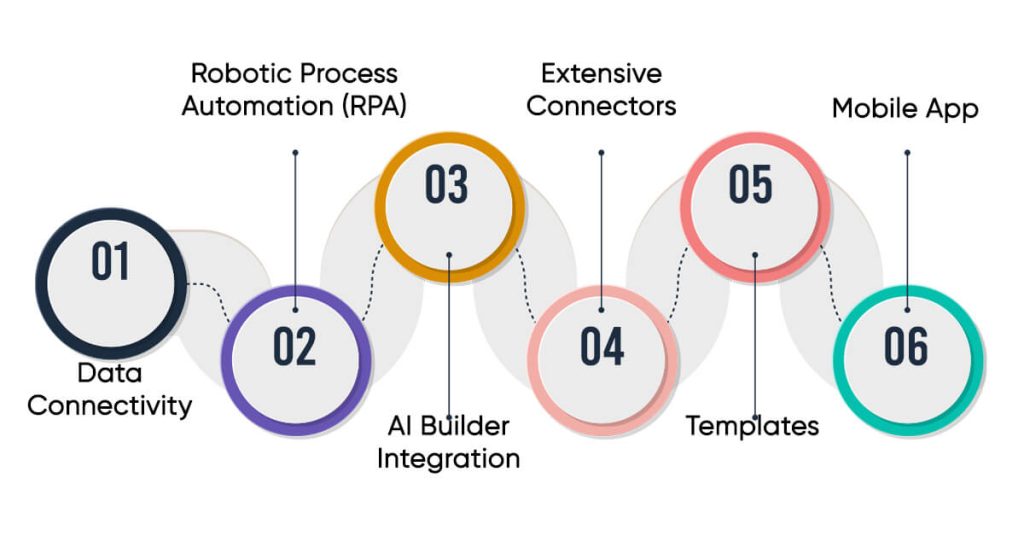
- Workflow Automation: Power Automate lets you set up automatic workflows between apps and services. This helps you sync files, get alerts, gather data, and do other tasks.
- Robotic Process Automation (RPA): Power Automate has RPA features to automate old systems and manual processes that don’t have APIs.
- AI Builder Integration: It includes AI abilities to handle forms, spot images and text, and guess outcomes.
- Extensive Connectors: Power Automate gives you over 350 ready-made connectors to link up with different apps and services.
- Templates: It offers many templates for common automation tasks making it simple for users to begin.
- Mobile App: Users can make and control flows from their phones.
Use Cases for Power Automate
- Approval processes automation
- Data collection and entry
- Social media management
- Customer service workflows
- IT operations automation
- Document generation and distribution
- Notification systems
- HR process automation
- Invoice processing and approval
- Budget allocation and tracking
- Task assignment and tracking
- Marketing campaign automation
- Email marketing automation
- Reorder process automation
- Compliance and regulatory reporting
- Automated response to customer feedback
- Quote generation and approval
- Booking automation
- Contract review and approval workflow
- Manufacturing process automation
- Energy sector applications
Connect your apps, automate repetitive tasks, and accelerate your digital transformation!
Comparing Power BI and Power Automate
Aspect | Power BI | Power Automate |
Primary Function | Data visualization and analysis | Process and task automation |
User Focus | Data analysts, business users, decision-makers | Process owners, IT professionals, and business users across departments |
Data Handling | Analyzes and visualizes data | Moves and processes data between systems |
Integration | Focuses on data sources | Connects various apps and services |
Output | Interactive reports and dashboards | Automated workflows and processes |
User Interface | Dashboard-centric for creating reports and visualizations | Flow designer for creating step-by-step automated processes |
Learning Curve | Steeper, especially for advanced features | Generally easier, especially with pre-built templates |
When to Use |
|
|
Power BI vs Power Automate: Integration Capabilities
Feature | Power BI | Power Automate |
Primary Focus | Data source integrations | Workflow integrations |
Integration Types | Connects to databases, cloud services, and applications | Creates workflows across applications and services |
Number of Connectors | Extensive (exact number not specified) | Over 350 connectors |
Key Integration Areas | SQL Server | Microsoft 365 applications |
Strength | Comprehensive reports from multiple data sources | Complex, cross-platform workflows |
Which is better: Power BI or Power Automate?
Power BI and Power Automate serve different purposes. Power BI specializes in business intelligence and data visualization, transforming raw data into meaningful insights for decision-making. Power Automate uses revolve around workflow automation, streamlining processes, and reducing manual work.
The better tool depends on your needs – Power BI for data analysis and reporting, or Power Automate for task automation. Many organizations benefit from using both tools together, creating a powerful ecosystem for business intelligence and automation.
Synergies Between Power BI and Power Automate

While Power Automate and Power BI tools have distinct primary functions, they can work together to create powerful solutions:
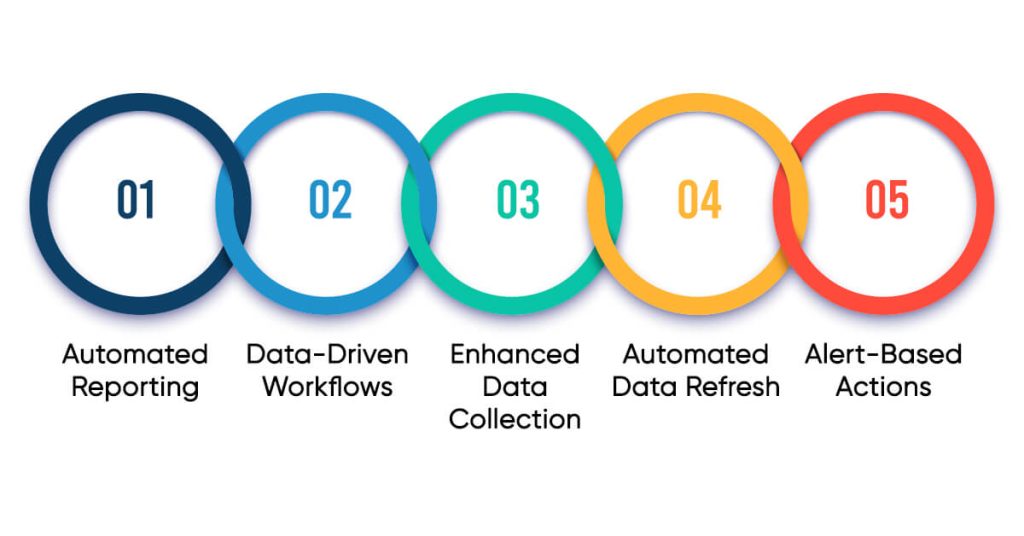
- Automated Reporting: Power Automate schedules and sends out Power BI reports without manual effort.
- Data-Driven Workflows: Power BI insights or set thresholds start Power Automate flows.
- Enhanced Data Collection: Power Automate gathers data from different places, which Power BI then breaks down.
- Automated Data Refresh: Power Automate updates Power BI data at set times.
- Alert-Based Actions: Power Automate kicks off when Power BI reports show certain things.
Conclusion
Both Power BI and Power Automate play key roles in Microsoft’s Power Platform ecosystem. Power BI turns raw data into useful insights through strong visuals and analysis. Power Automate, in contrast, focuses on making processes and workflows run across different apps and services. Knowing what each tool does best and where to use them helps companies make the most of them. They can use these tools on their own or together to boost data-based choices and get work done more.
As companies go digital and look for ways to get ahead, knowing how to use these tools has a growing impact on today’s work world. These tools can build a more productive and data-focused work setting. This lets them tap into what each tool does best to spark change across the company and reach their business targets.
Transform your business operations with X-Byte Analytics’ Power Automate and Power BI expertise! Get in touch now!
Frequently Asked Questions
What are the main differences between Power BI and Power Automate?
Businesses use Power BI to visualize data and gain business insights. It lets users build dashboards and reports you can interact with. Power Automate, however, is all about making workflows run. It helps users cut down on tasks they do over and over and bring together different apps and services.
Can Power BI and Power Automate be used together?
Yes, Power BI and Power Automate can be integrated together. Both are Microsoft apps and part of its multiple power apps. Both have features, that if used together can benefit businesses.
How much does Power BI cost?
Power BI comes with multiple pricing options:
- Power BI Free: A basic version with limited features, suitable for individual use.
- Power BI Pro: $10/user/month, offering full sharing and collaboration capabilities.
- Power BI Premium Per User: $20/user/month, providing advanced features and larger data capacities.
- Power BI Embedded and Microsoft Fabric options: Variable pricing for enterprise-level needs and embedded analytics.
How much does Power Automate cost?
Power Automate pricing comes in the below plans:
- Power Automate Free Trial: A 30-day free trial to explore cloud flows and standard connectors.
- Power Automate Premium: $15/user/month, includes cloud flows, attended desktop flows, and AI Builder credits.
- Power Automate Process: $150/bot/month, features unattended desktop flows and increased AI capabilities.
- Power Automate Hosted Process: $215/bot/month, includes all Process features plus a Microsoft hosted virtual machine.
What are the main benefits of using Power BI for business intelligence?
Power BI offers several key advantages. It can link up with many data sources, create visuals you can play around with, and spread insights throughout a company. This tool also helps people make choices based on data. Users can access it on their phones, and it gets new features through regular updates.
What are the main benefits of using Power Automate for workflow automation?
Power Automate is a powerful workflow automation tool that lets businesses create automated processes across applications without extensive coding. It helps automate repetitive tasks, reducing errors and saving time. The platform’s strength lies in its extensive integration capabilities, pre-built connectors, AI capabilities, and more.


