- Home
- CFO Dashboard
CFO Dashboard
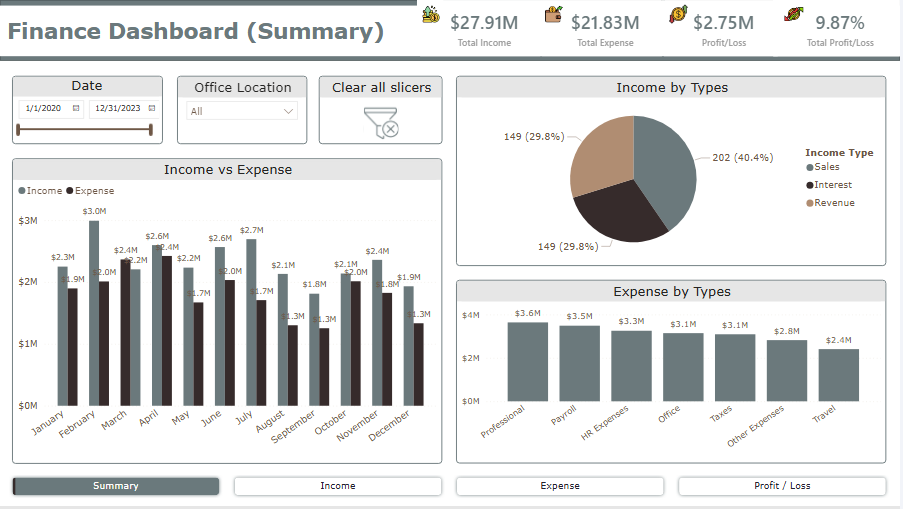
Integrate financial KPIs to get efficient financial oversight, and data consolidation for a data-driven decision-making process using the Power BI CFO dashboard. CFOs can efficiently utilize large datasets for precise analysis and strategic forecasting to achieve financial goals. With a custom CFO dashboard, decision-makers, directors, and chief financial officers can gauge into determining business financial performance.

Trusted by conglomerates, enterprises, and startups


What is the CFO Dashboard?
The CFO dashboard solution is an interactive data visualization tool that integrates diverse financial data to present it in a centralized platform. A cloud-based CFO dashboard for real-time data includes revenue, net profit, current ratio, EBITDA, COGS, quick ratio, working capital, cash flow, and other enterprise financial data. Combining real-time financial data to provide financial performance in CFO dashboards becomes easy.
Businesses can automate the development and data-gathering process of CFO financial dashboards by utilizing advanced data visualization tools. Financial reporting automation in CFO dashboards allows stakeholders to create achievable strategies that align with the business’s financial goals.
Live Dashboard
An interactive CFO Dashboard provides an at-a-glance view of critical business metrics, empowering leaders to make informed decisions.
Drive Financial Success with Data-Driven Decisions!
Why to Use Power BI CFO Dashboard?
Custom CFO dashboards help maintain the company’s financial health, overall performance, and strategic plans by providing dynamic data visualizations, ease of integration with financial systems, and real-time updates. Our interactive solutions utilize diverse data visualization tools and techniques to monitor market trends, performance metrics, and other financial aspects.
By utilzing the capabilities of Power BI like data connectivity, automation of data refresh, and compatibility with various financial data sources, businesses can get easy accessibility and ensuring user friendliness at affordable pricing strategies.
With cost-effective CFO dashboard solutions, decision-makers can easily access the CFO dashboard from any device to forecast upcoming opportunities. The performance management dashboards for CFOs helps them take proactive measures and adjust strategies to navigate business challenges and achieve overall financial success.

Our CFO Dashboard Services
Revenue Dashboard
Benefits of Revenue Dashboard
- Monitor revenue targets
- Analyse historical performance
- Understanding revenue trends
- Optimize business offerings
Expense Management Dashboard
Benefits of Expense Management Dashboard
- Categorize expense easily
- Control over expenses
- Streamline fund allocation
- Track spending trends
Forecast Dashboard
Benefits of Forecast Dashboard
- Predict revenues, expenses, and cash flows
- Accurate forecasting
- Smooth integration with diverse sources
Sales Dashboard
Benefits of Sales Dashboard
- Track sales KPIs
- Real time monitoring of sales target
- Adjust strategies
- Performance tracking
Profit and Loss Dashboard
Benefits of Profit and Loss Dashboard
- Track P/L in real time
- Maximize profitability
- Optimize costs
- Address inefficiencies
Balance Dashboard
Benefits of Balance Dashboard
- Track assets and liabilities
- Monitors equity trends
- Analyze financial stability
- Identify growth opportunities
Cash Flow Dashboard
Benefits of Cash Flow Dashboard
- Effective cash flow management
- Manage working capital
- Achieve operational needs
- Identify business liquidity
Connect With Us Now
Case Studies
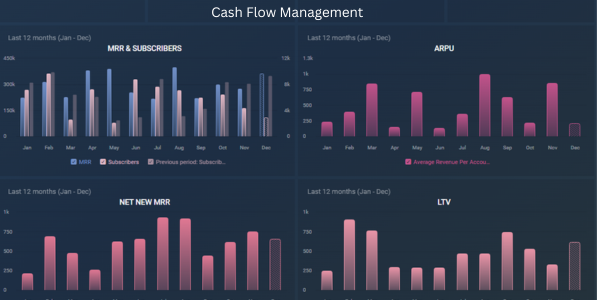
Enhancing Cash Flow Management
Overview
Challenges
Solutions
X-Byte Analytics has provided a cash flow dashboard with real-time visibility into cash flow and implemented predictive analytics to identify potential shortfalls for smoother operations and timely vendor payments.
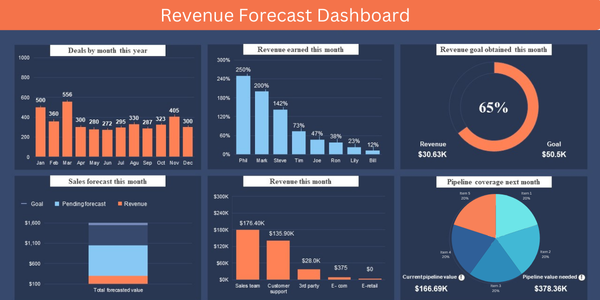
Streamlining Revenue Forecasting
Overview
Challenges
Solutions
Audience
KPIs
How to Create a CFO Dashboard?
We analyze custom CFO dashboards to assist businesses in combining diverse financial aspects to enhance analysis and strategy formation. Interactive dashboards can be created to boost financial performance by implementing modern data visualization tools and financial forecasting metrics. We integrate real-time financial data for CFO analytics dashboards by delivering cost-effective solutions tailored to business requirements.

Our Power BI developers utilize advanced tools and technologies to create digital prototypes and interactive platforms based on the required features and functionalities of CFO KPI dashboard. After finalizing the designs, we develop the dashboard using tools and technologies for enhanced financial modeling.
After developing the Power BI financial dashboard, we perform rigorous testing using different approaches and solve the bugs found. We then deploy the dashboard using Power BI, which helps embed the solution within existing systems and ensures easy mobile access.
We ensure uninterrupted support and maintenance service for data refresh scheduling and updating financial metrics in real time. This helps enhance the performance of the MicroStrategy CFO dashboard and provides smooth functionality for the solution.
