Insurance Dashboard
X-Byte’s custom Power BI dashboard for insurance analytics empowers companies to make better strategic decisions by vivid visualization of insurance KPIs like policy claims frequency, net earned premiums, retention, quotes, etc.

Trusted by conglomerates, enterprises, and startups


What is an Insurance Dashboard?
Insurance dashboards enable insurance companies, and underwriters to make the right business decisions by visually representing vast business data like claim amount, the claim by month, premium amount, and customer profile, on the Insurance claims dashboard using Power BI. It unifies all internal and external processes and operations related to the business in real time and simplifies decision-making for key decision-makers.
Custom dashboards for insurance improve business efficiency by aiding in the better management of claims, fraud detection, and operation. Insurance KPI dashboards allow insurance companies to provide a better customer experience by providing visual graphs, charts, and maps of customer buying preferences, transactions, reviews, and feedback.
Live Dashboard
Make Flawless And Unbiased Insurance Decisions!
Why Use an Insurance Dashboard?
X-Byte’s Insurance analytics dashboard solutions enable insurance giants in the fields of health insurance, automotive insurance, property insurance, travel insurance, etc, to quickly and accurately observe bright spots for growth. Our insurance BI solutions and customizable insurance KPI dashboards make data useful and actionable for companies.
X-Byte’s Power BI dashboard for insurance analytics enables accurate analysis of the vast amount of data within the company ecosystems improves risk management, helps strategize pricing, tracks claim settlement times, and delivers insights for improving customer satisfaction.

What are the Benefits of Insurance Dashboards?
Incorporate a customizable insurance KPI dashboard using Power BI to accelerate business decision-making, and monitor and analyze data concerning full-spectrum business KPIs like the end-to-end automated management of claims. Achieve accelerated business growth, and eliminate bottlenecks through powerful insurance dashboards.
Adopt a “single source of truth” for analyzing your insurance business’ performance through real-time analysis for claim settlement efficiency. Expedite settlements, and track risk through interactive dashboards while ensuring financial stability through real-time premium collection insights from user accounts globally.
Eliminate the hassles of managing multiple accounts globally through consolidated customer data access on Power BI dashboards. Achieve hyper-business growth through multi-channel integration of data from sales agents, online platforms, and third-party brokers, while adhering to regulatory compliance.
Be known as a data-driven organization that harnesses the potential of the next-generation Power BI dashboards for custom claims analysis through detailed reports based on multiple data fields like demographic, claim type, etc. View anomalies and discrepancies without spending hours on analysis of data through automated fraud detection reports that flag suspicious patterns in claims. Monitor sales performance and pivot strategies for better business perspectives.
Kickstart a cycle of continuous improvement through visualization of key aspects like loss ratio, and policy purchase, claim ratio through Insurance data visualization tools. Get a bird’s eye view of policy distributions and risk-prone areas on interactive maps and charts and monitor policy growth metrics through minute tracking over intelligent custom insurance dashboards.
Contact Us Today
Insurance Dashboard Examples
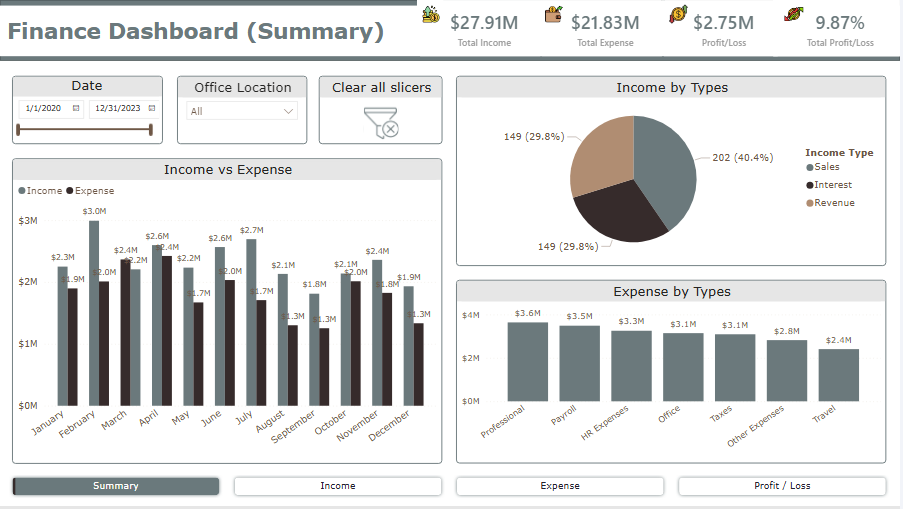
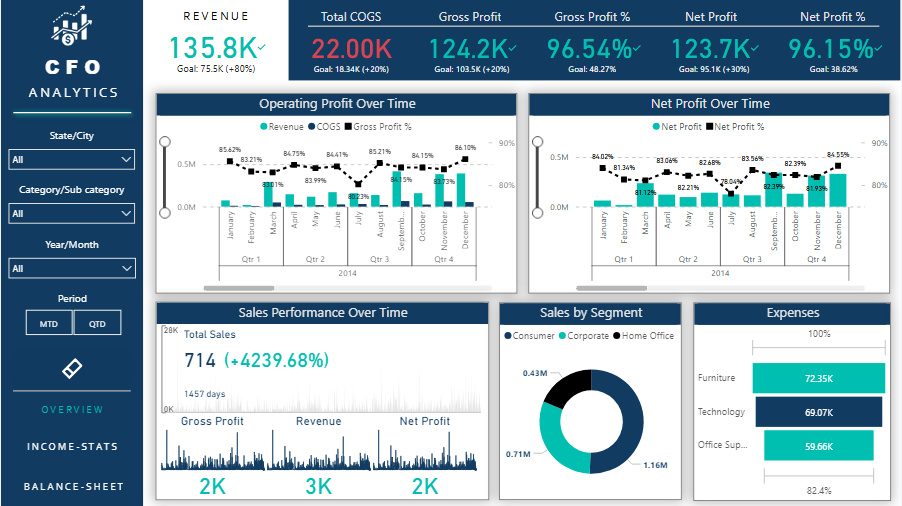
Collate data from various systems of your enterprise’s ecosystem and get a unified view of all you need for key business decision-making using our highly intuitive, real-time interactive insurance dashboard. Know how our Power BI templates for insurance dashboards can help you hit the ground running so that you get intelligent insights from day one.
Insurance Claims Dashboards
Benefits of Insurance Claims Dashboards
- Check trends in claims
- Manage claims efficiently
- Improve claims processing
- Track claims settlement ratio
Insurance Performance Metrics Dashboard
Benefits of Insurance Performance Metrics Dashboard
- Check and pivot strategies based on trends
- Improve debt management
- Take key financial decisions
- View financial KPIs on a single dashboard
Risk Management Dashboards
Benefits of Risk Management Dashboards
- Better visibility into the operation
- Real-time tracking of KPIs
- Address risks based on priority
- Improved risk awareness
Sales & Service Insurance Dashboard
Benefits of Sales and Service Insurance Dashboards
- Monitor sales growth rate
- Track total expenses and revenue
- View the performance of varied insurance products
- Monitor agent performance, referrals, and avg. Policy size
Customer Analytics Dashboards
Benefits of Customer Analytics Dashboards
- Segment customers
- Predict churn
- Gain analytics for improved customer service
- Get deep insight into customer needs.
Insurance Sales Dashboard
Benefits of Insurance Sales Dashboards
- Track performance in real-time
- Monitor monthly, and annual sales
- Make data-driven decisions
- Improve team Accountability
- Simplify target achievement
Audience
How to Create an Insurance Dashboard in Power BI?
Drive transparency across your business ecosystem through simplified data-backed decision-making powered by interactive Insurance dashboards. X-Byte’s team of experts develops well-designed dashboards that act as potent tools to identify and eliminate bottlenecks in the complex insurance sector. Prioritize and address top-level business goals through unified, intuitive, and interactive insurance dashboards developed with meticulous precision by experts at X-Byte.

The first phase clear understanding of the results expected from the Insurance policy dashboard and takes into account key insurance metrics like policy sales, claim settlement ratio, customer retention rate, and lead conversion time, followed by mapping these KPIs to different user roles.
The second phase comprises work on actual data where data from various sources like CRMs, policy administration systems, claims management systems, and customer databases are integrated. Additionally, ETL tools are used to make the best use of enterprise data
The third phase involves the development of a customizable insurance dashboard for insurance-specific workflows and metrics with a special focus on the creation of role-specific dashboards to monitor premium growth, agent performance, customer acquisition cost, etc.
The last stage involves the deployment of dashboards on-premise or on the cloud based on the client’s existing infrastructure. In-house teams are trained on the use of dashboards and trained on navigation, filters, and reports.


