


Cash Management Dashboard
Our Cash Management Dashboard is created to track cash flow trends with real-time Power BI dashboards. This also assists in seamlessly monitoring liquidity, predicting shortages, and optimizing cash allocation to ensure boosted productivity.
Benefits of Cash Management Dashboard
- Improved cash flow visibility
- Enhanced liquidity management
- Timely alerts for cash shortages or surpluses
- Informed cash investment decisions

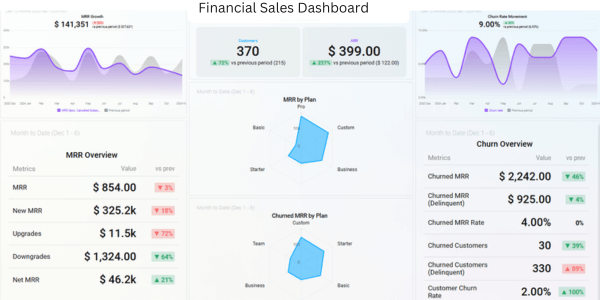
Financial KPI Dashboard
Our Financial KPI Dashboard covers essential financial KPIs for measuring your organization’s economic requirements. Financial dashboard software helps us visualize financial performance indicators such as revenue growth, profitability, return on investment, etc.
Benefits of Financial KPI Dashboard
- Centralized view of key metrics
- Enhanced performance tracking
- Quick insights into financial trends
- Strategic planning support

Profit and Loss Dashboard
Our Profit and Loss (P&L) Dashboard offers a snapshot of the stated period's revenues, costs, and profit or loss. This dashboard is used for general performance indicators concerning the business and analysis of the financial data.
Benefits of Profit and Loss Dashboard
- Detailed profit insights
- Effective expense management
- Performance tracking over periods/li>
- Evaluation of financial stability

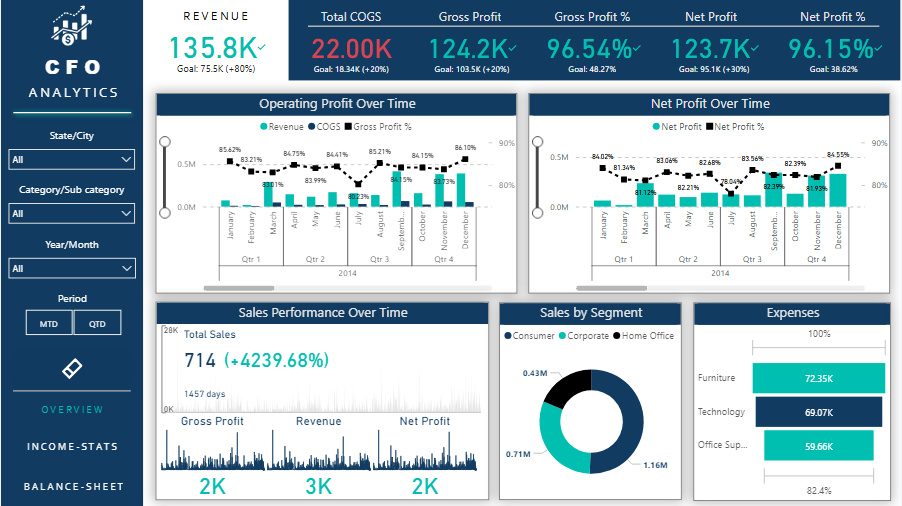
CFO Dashboard
The Power BI CFO Dashboard provides strategic insights into the company’s financial performance and condition, focusing on cash flow, income statement, and company ratios. It provides real-time data visualization for data-driven decisions to achieve long-term goals.
Benefits of CFO Dashboard
- Strategic financial insights
- Enhanced decision-making capabilities
- Real-time financial updates
- Comprehensive reporting for executives

CAGR Dashboard
CAGR Dashboard refers to an essential Performance Measure Dashboard used to track long-term growth rates. Using the financial dashboard examples and applying the Power BI financial dashboard features, these growth rates are described in detail, and the data is compared to industry averages.
Benefits of CAGR Dashboard
- Long-term growth tracking
- Trend analysis for growth strategies
- Informed forecasting and projections
- Measurement of strategic initiative impacts

Actual vs Forecast Dashboard
The Actual vs. Forecast Dashboard uses Power BI's forecasting tools to predict future revenue, expenses, and profitability trends to overcome financial challenges in real time. This approach ensures that your CFO financial dashboard supports accurate and effective decision-making.
Benefits of Actual vs Forecast Dashboard
- Variance analysis between actual and forecasted data
- Evaluation of forecast accuracy
- Improved financial planning
- Strategic adjustments based on performance data

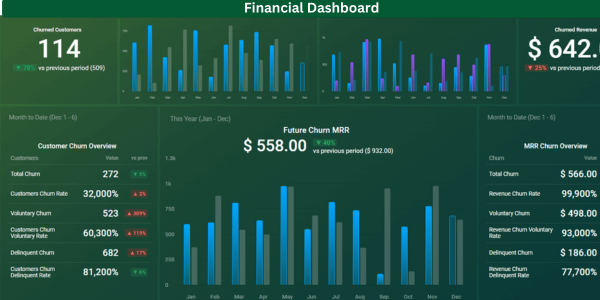
Financial Performance Dashboard
The Financial Performance Dashboard is a multifunctional instrument that provides the overall picture of the financial state of your organization. We customize the financial management dashboard to provide a clear and actionable overview, helping you track progress toward your goals and make informed business decisions with precision.
Benefits of Financial Performance Dashboard
- A holistic view of financial performance
- Monitoring of key financial metrics
- Informed decision-making
- Identification of performance improvement areas
Operating Expenses Dashboard
Our Operating Expense Dashboard is designed to give real-time insight and measurement of operation expenses. With features similar to personal financial dashboards, this tool helps identify areas for cost optimization and ensures expenses align with your budget.
Benefits of Operating Expenses Dashboard
- Real-time expense tracking
- Control over operating costs
- Budget adherence monitoring
- Efficiency improvement in expense management