Quick Summary:
Power BI is expanding as an advanced and business friendly tool that provides an interactive and easy-to-understand dashboard by compiling data from various sources. In this detailed blog, we will understand different types of Power BI dashboards with features and KPIs and their pros and cons. This blog will also outline the key components of the Power BI dashboard that make it more intuitive and user-friendly.
Introduction
There is ample data available in the business that must be compiled into a smooth analysis process on a single platform. There are various tools and platforms, but Power BI is at the top of them. This is due to its capabilities, which make it more intuitive, easy to integrate with diverse platforms, and user-friendly. The advanced analytical functionalities of Power BI provide enhanced data visualization and allow organizations to open opportunities to expand.
Overview of Power BI Dashboards
Power BI is a Microsoft tool that assists diverse businesses by providing user-friendly, scalable, and custom visualization. These advanced capabilities help smooth data analytics by integrating diverse business intelligence(BI) platforms and tools.
The global BI market is expected to grow at a fast pace:
- The global BI market is estimated to grow from $29.42B in 2024 to $54.27B by 2030.
- AI and ML technologies will expand the capabilities of BI tools to automate tasks, and predictions, and provide insights.
- The organic growth is created by the development of AI and machine learning, which focus BI tools on accurate prediction, eliminate the need for boring and tedious tasks, and allow for business-oriented information.
- Microsoft PowerBI had the second largest market share of best Business Intelligence Solutions with 15.97% in 2024; third is Tableau, SAP Crystal Solution, and fourth is NetSuite.
- Based on revenue, Statista states that the BI market will grow at a CAGR of 5.71% to 2024 and reach US$27.36bn in 2024, making the market volume US$34.16 bn by the end of 2028.
- The average annual expenditure per employee in the BI software market will also rise steeply to an estimated US$7.80 in 2024.
| Benefits of Power BI |
|
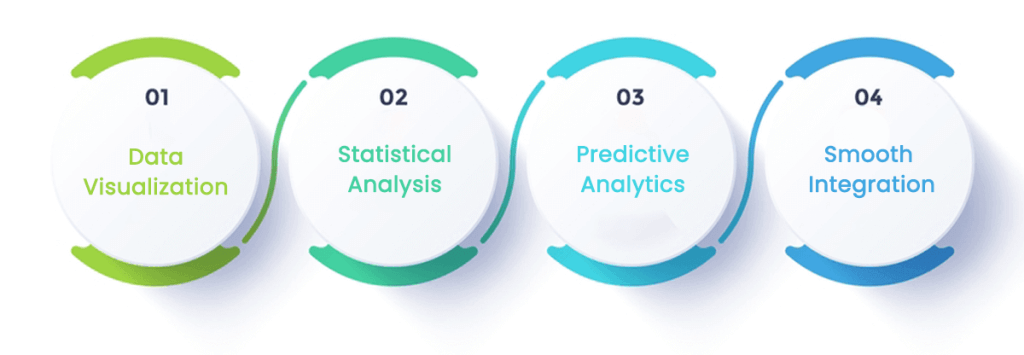
Highlighting Features of Power BI

- Data Visualization
Power BI helps transform a large amount of data into interactive visualizations for a smooth analysis process.
- Statistical Analysis
The Power BI has advanced capabilities that help statistical analysis, such as Data Analysis Expressions (DAX) functions and visuals.
- Predictive analytics
Power BI’s built-in data analytics and advanced machine learning capabilities can help predict future market trends.
- Smooth Integration
The advanced Power BI can easily integrate Excel and other data sources for smooth data analysis.
Represent the large amount of data with custom dashboards and streamline the decision making process.
Key Components of Power BI Dashboard

Creating an interactive and optimized Power BI dashboard involves careful planning, thoughtful design, and a focus on user needs. Here are the key factors that contribute to an user-friendly KPI Power BI dashboard:
1. Clear Objective and Goals
An interactive dashboard should have a clearly defined purpose that guides its design and content. Without a specific objective, dashboards can become cluttered, making it hard for users to find relevant information and analyze the data.
2. User-centric Design
The Power BI dashboard prioritizes the user experience to streamline the analysis process by presenting information logically and minimizing the cognitive load. To create a user-centric design, it is advisable to use a visual hierarchy to highlight key metrics and avoid overloading with too many visuals.
3. Data Accuracy and Reliability
User-friendly and interactive dashboards can efficiently and accurately display a large volume of data. They provide real-time data visibility and usability by regularly refreshing the data using Power BI’s scheduled refresh. This can be done seamlessly by ensuring proper data governance to avoid inconsistencies.
4. Effective Visualization
Diverse visualizations include charts, tables, graphs, heatmaps, and KPI highlights. Choosing the right visualization tool and design is important to make the data interactive and easily understood.
5. Responsiveness and Optimization
Power BI tools and capabilities facilitate easy access by integrating diverse sources for real-time data analysis. The dashboards must be accessible on various devices, such as desktops, tablets, and smartphones. It is also important to ensure the dashboard’s quick loading speed and respond promptly to user interactions.
6.Scalability and Accessibility
It is important to create dashboards that grow with business needs without requiring a complete overhaul and should be accessible by diverse parties. Parameters must also be used to make dashboards adaptable to different datasets and use high-contrast colors with readable fonts. To ensure scalability and accessibility, modular data models should be built that easily integrate new metrics.
Power BI Dashboard Examples
1. Power BI Financial dashboard

Implement the financial KPI dashboard to monitor and analyze the organization’s financial performance. This dashboard also helps forecast and monitor the business’s financial health and track operations regarding finances. Smoothly managing the financial aspects helps businesses in real-time fund management by tracking Financial metrics.
KPIs
- Revenue growth rate
- Net profit margin
- Cash flow (inflows and outflows)
- Debt-to-equity ratio
- Budget variance (planned vs. actual)
- Return on investment (ROI)
- Working capital
Pros
- Provides real-time insights into financial health.
- Simplifies complex financial data into easy-to-read visuals.
- Tracks budget vs. actuals for better financial control.
- Enables forecasting and strategic planning.
Cons
- Requires accurate and updated financial data for effective analysis.
- Complex setup if integrating multiple financial systems.
- Limited for detailed, industry-specific financial modeling.
2. Power BI Sales Dashboard

Monitor the sales department and professional performance by getting a comprehensive overview using an advanced Power BI sales dashboard. This interactive sales metrics dashboard provides insights into sales performance, lead management, conversion ratio, and sales funnel monitoring.
KPIs
- Total sales revenue
- Sales growth rate
- Average deal size
- Conversion rate
- Sales by region/product/category
- Customer acquisition cost (CAC)
- Lead-to-close ratio
Pros
- Tracks sales performance, customer acquisition, and retention.
- Identifies high-performing products, regions, or sales reps.
- Supports target tracking and sales forecastin
Cons
- Requires integration with CRM systems for comprehensive analysis.
- May need customization for niche sales processes.
- Insights depend on data quality and completeness.
3. Power BI Healthcare Dashboard

Digitize the hospital and patient management process to ensure real-time tracking. The interactive healthcare management dashboard helps collect and monitor hospital data to streamline routine operations and patient management. It also helps manage patient healthcare status, appointments, staff attendance, facilities, and doctors, beds, and equipment availability.
KPIs
- Patient admissions and discharges
- Bed occupancy rate
- Average treatment cost per patient
- Readmission rate
- Treatment success rate
- Staff-to-patient ratio
- Appointment wait time
Pros
- Tracks patient care metrics and hospital performance.
- Helps allocate resources efficiently.
- Ensures compliance and enhances service quality.
Cons
- May require significant customization for specific healthcare setups.
- Sensitive to data privacy and security concerns (e.g., HIPAA compliance).
- Limited clinical insights without integration with advanced healthcare tools.
4. Power BI Inventory Dashboard

Implement Power BI inventory management dashboard to manage business inventory efficiently in real time. It allows different businesses to seamlessly track the inventory cost, monitor and examining market.
KPIs
- Inventory value
- Total vendors
- Inventory restocking costs
- Inventory value by item name
- Inventory value by vendor
- Inventory purchase
Pros
- Automated solution to managing your inventory
- Get detailed insights for optimization
- Allows real-time inventory tracking
- Constant inventory monitoring
- Analyze key vendors smoothly
Cons
- Complexity in setup
- High costs for advanced features
- Limited mobile customization
- Limited predictive analytics
5. Power BI Project Management Dashboard

Power BI project management dashboards help manage multiple projects and activities. To ensure a smooth project life cycle, managing complexities and diverse projects simultaneously is important. So, an efficient project management dashboard should easily handle the complexities and represent diverse datasets in an engaging visualization. This helps in the optimum utilization and allocation of resources for a streamlined project life cycle.
KPIs
- Project completion percentage
- Milestone achievement rate
- Budget utilization (planned vs. actual)
- Task completion rate
- Resource allocation efficiency
- Risk occurrence frequency
Pros
- Tracks project timelines, budgets, and resource utilization.
- Provides real-time status updates and risk insights.
- Helps ensure timely project delivery.
Cons
- Requires integration with project management tools like MS Project or Jira.
- Limited for large-scale, multi-phase projects without customizations.
- It can become overwhelming if too many metrics are tracked.
6. Power BI Marketing Dashboard

Diverse marketing activities are involved in a business, from ad campaigns and market analysis to social media and email marketing. Power BI marketing dashboards compile diverse marketing activities to enable strategic decision-making processes. This assists the marketing team in analyzing multiple marketing activities using a single platform to drive sales.
KPIs
- Marketing ROI
- Customer acquisition cost (CAC)
- Website traffic (sessions, unique visitors)
- Lead conversion rate
- Cost per lead (CPL)
- Social media engagement (likes, shares, comments)
- Email open and click-through rates
Pros
- Tracks campaign performance, ROI, and audience engagement.
- Supports channel-specific analysis (social media, email, paid ads).
- Helps refine marketing strategies for better results.
Cons
- Needs integration with marketing platforms (Google Ads, HubSpot, etc.).
- Advanced attribution modeling may require third-party tools.
- Limited in handling qualitative data like customer sentiment.
7. Power BI IT Dashboard

IT operations require implementing high-tech security and safety standards. Adopting a highly secured and scalable IT metrics dashboard ensures smooth IT operations and processes management.
KPIs
- System uptime/downtime
- Mean time to resolution (MTTR)
- Incident response time
- Number of IT tickets resolved
- Network performance metrics (latency, bandwidth)
- Application performance metrics
- Security incident count
Pros
- Monitors IT performance, system health, and ticket resolutions.
- Reduces downtime and improves operational efficiency.
- Identifies recurring issues for preventive action.
Cons
- Requires robust integration with IT management tools (e.g., ServiceNow).
- Limited scope for deep system performance diagnostics.
- It can be data-heavy, making it less user-friendly.
8. Power BI Logistics Dashboard

The Power BI logistics management dashboard helps monitor logistics and the flow of goods to make informed decisions. The logistics KPI dashboard ultimately aims to optimize the movement of goods in the supply chain. It also streamlines logistics management and workflow processes. It ensures delivery efficiency, reduces costs, and timely shipment of goods.
KPIs
- On-time delivery rate
- Transportation cost per shipment
- Order cycle time
- Warehouse utilization rate
- Inventory accuracy
- Shipping error rate
- Freight cost as a percentage of sales
Pros
- Tracks delivery performance, transportation costs, and inventory in transit.
- Optimizes supply chain efficiency and reduces delays.
- Enhances customer satisfaction with better delivery metrics.
Cons
- Needs seamless data integration from logistics and shipping systems.
- May struggle with highly complex supply chains.
- Predictive logistics insights require advanced analytics tools.
Transform the data analysis process with our expertise in advanced technology to create the interactive dashboard.
9. Ecommerce Dashboard

Establish a streamlined and scalable online retail store to reach customer segments and fulfill requirements. To drive growth, the ecommerce metrics dashboard helps understand sales trends, customer behavior, and website performance. With high-performing eCommerce dashboard, online stores can easily track the performance of an online store.
KPIs
- Total sales (online)
- Conversion rate
- Cart abandonment rate
- Average order value (AOV)
- Customer lifetime value (CLV)
- Traffic sources (organic, paid, referral)
- Return rate
Pros
- Tracks online sales, traffic, and customer behavior.
- Provides insights into cart abandonment, conversion rates, and product performance.
- Helps optimize marketing efforts and user experience.
Cons
- It requires integration with e-commerce platforms (Shopify, WooCommerce).
- Limited in analyzing qualitative user feedback.
- Data silos can lead to incomplete analysis.
10 . Power BI Business Dashboard

Streamline and monitor business processes with a comprehensive business management dashboard. Business dashboard powered by Power BI provides a high-level overview of an organization’s performance across various departments. Consolidating key metrics regarding various departments into a single interactive dashboard helps the strategic decision-making process.
KPIs
- Revenue growth
- Operating expenses as a percentage of revenue
- Gross profit margin
- Employee productivity rate
- Customer satisfaction score (CSAT)
- Average handling time (AHT)
- Strategic goal achievement rate
Pros
- Consolidates performance metrics from multiple departments.
- Supports executive-level decision-making.
- Provides a comprehensive view of organizational health.
Cons
- Needs input from multiple systems for holistic insights.
- Overloaded dashboards may confuse users.
- Requires constant data updates to stay relevant.
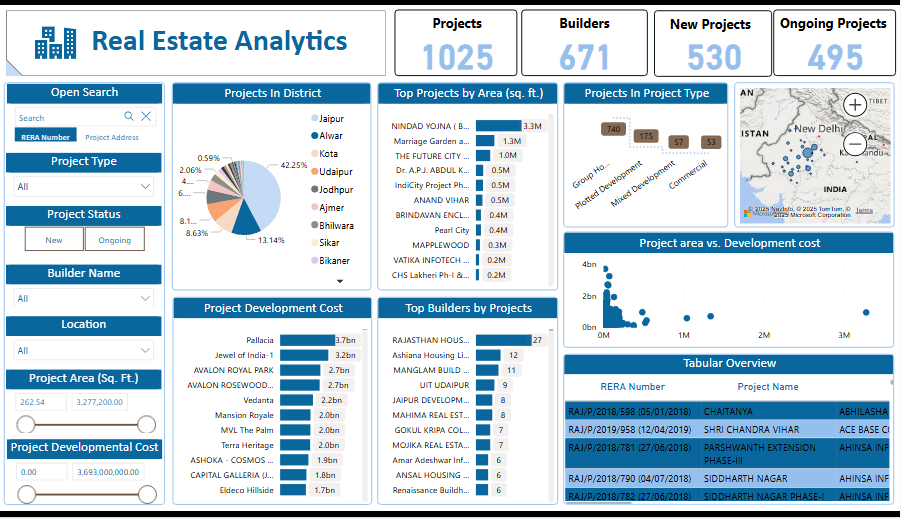
11. Real Estate Dashboard

Real estate businesses must manage large amounts of data to ensure smooth operations. A comprehensive real estate dashboard helps manage complex data, real estate portfolios, and market trends. It helps property managers and investors maximize returns and monitor property performance.
KPIs
- Occupancy rate
- Rental income by property
- Property ROI
- Days on the market (for sales)
- Lease renewal rate
- Operating expense ratio
- Market value vs. appraised value
Pros
- Tracks property performance, occupancy, and rental income.
- Analyzes market trends and investment opportunities.
- Simplifies portfolio management for real estate professionals.
Cons
- Requires integration with property management tools.
- Limited in forecasting long-term market trends.
- Customization is needed for diverse real estate types.
12. Manufacturing Dashboard

Monitor production processes to ensure smooth resource utilization and optimize the manufacturing process. The production dashboard is a tool for tracking production processes, efficiency, and operational costs. It also helps identify bottlenecks, reduce waste, and improve production output, ensuring top-notch quality.
KPIs
- Production output
- Cycle time (time to produce one unit)
- Downtime (planned vs. unplanned)
- First-pass yield (FPY)
- Scrap rate
- Cost per unit produced
- Overall equipment effectiveness (OEE)
Pros
- Tracks production efficiency, equipment downtime, and quality metrics.
- Identifies bottlenecks and cost-saving opportunities.
- Enhances overall production planning.
Cons
- Requires integration with manufacturing execution systems (MES).
- Limited advanced analytics without AI tools.
- Complex setups for large-scale manufacturing plants.
13. CMO Dashboard

Implementing a dashboard for top-level managers can easily create achievable marketing strategies and practices. Monitor and analyze marketing processes and efforts in real-time to boost them. The CMO dashboard is a marketing analytics tool that helps align marketing efforts with diverse business goals.
KPIs
- Campaign performance metrics (CTR, impressions)
- Marketing spend vs. revenue
- Brand awareness metrics
- Share of voice (SOV)
- Customer retention rate
- Channel-specific ROI
- Engagement rate
Pros
- Aligns marketing strategies with overall business goals.
- Tracks brand performance, market share, and campaign effectiveness.
- Helps allocate resources for high ROI.
Cons
- Needs integration with marketing tools for full functionality.
- May lack depth for advanced consumer behavior analysis.
- Customization is required for specific industries.
14. CEO Dashboard

The custom CEO dashboard is designed for CEOs to track company performance across all departments for smooth decision-making. This dashboard offers strategic insights to top-level managers for enhanced analysis.
KPIs
- Company revenue vs. expenses
- Profit margins
- Employee turnover rate
- Strategic initiative progress
- Customer Satisfaction/Net Promoter Score (NPS)
- Market share
- Cash runway (for startups)
Pros
- Offers a high-level overview of company performance.
- Tracks KPIs across finance, sales, operations, and HR.
- Supports data-driven strategic decision-making.
Cons
- Can be confusing without proper metric prioritization.
- Insights depend on accurate and timely data from all departments.
- Custom dashboards may be necessary for specific industries.
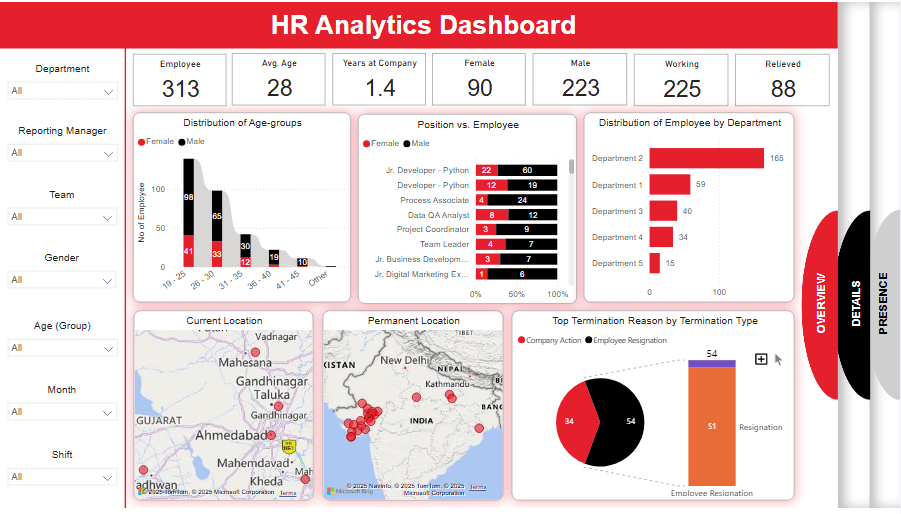
15. HR Analytics Dashboard

The interactive HR dashboard provides a one-stop solution for monitoring the department’s processes. This dashboard helps the HR team examine and make decisions in real-time regarding hiring, onboarding, employee management, and retention. The HR analytics dashboard also helps in smoothly analyzing workforce data to boost productivity, employee engagement, and the establishment of a positive work environment.
KPIs
- Employee turnover rate
- Time to hire
- Cost per hire
- Employee satisfaction score
- Training completion rates
- Absenteeism rate
- Diversity and inclusion metrics
Pros
- Tracks employee performance, engagement, and turnover rates.
- Supports workforce planning and talent acquisition strategies.
- Improves overall employee experience.
Cons
- Needs integration with HR tools like Workday or BambooHR.
- Limited analysis of qualitative factors like employee sentiment.
- Insights depend on data quality and consistency.
Build Power BI Dashboards To Transform Your Business
Power BI is a robust platform that helps in transforming complex data into actionable insights that help in smarter decision-making processes. To maximize its potential, your internal team must be skilled, or you can outsource to experts who provide you with market-leading dashboard solutions. X-byte Analytics provides custom Power BI dashboards to help your business grow and automate the business.
With X-Byte Analytics, your business can get:
- Comprehensive and integrated solutions
- Market-leading dashboards
- Progress tracking and analytics
- Streamlined decision-making process
- Real-time analytics
Discover how X-Byte Analytics can help your business seize market opportunities and reduce efforts in compiling data from diverse sources. With our expert services, your business can stay ahead of the curve in the data-driven market.


